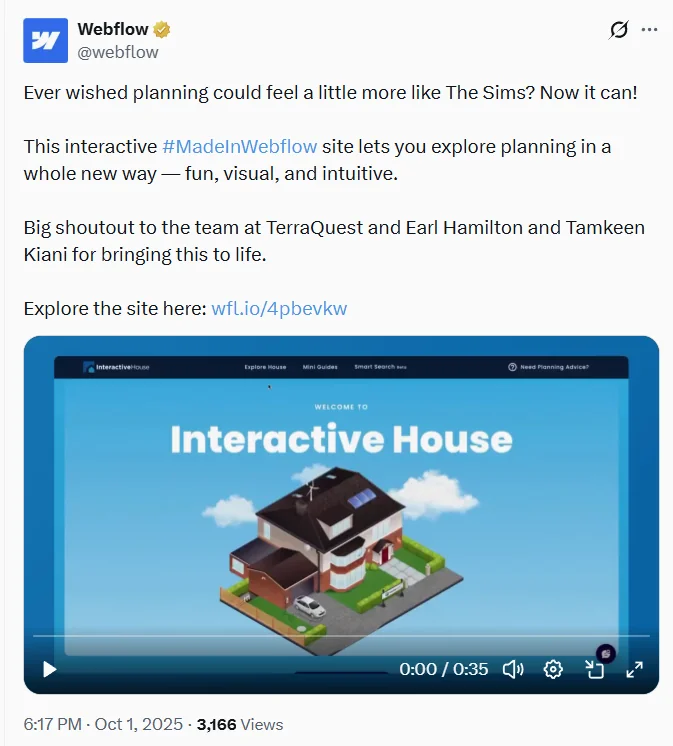
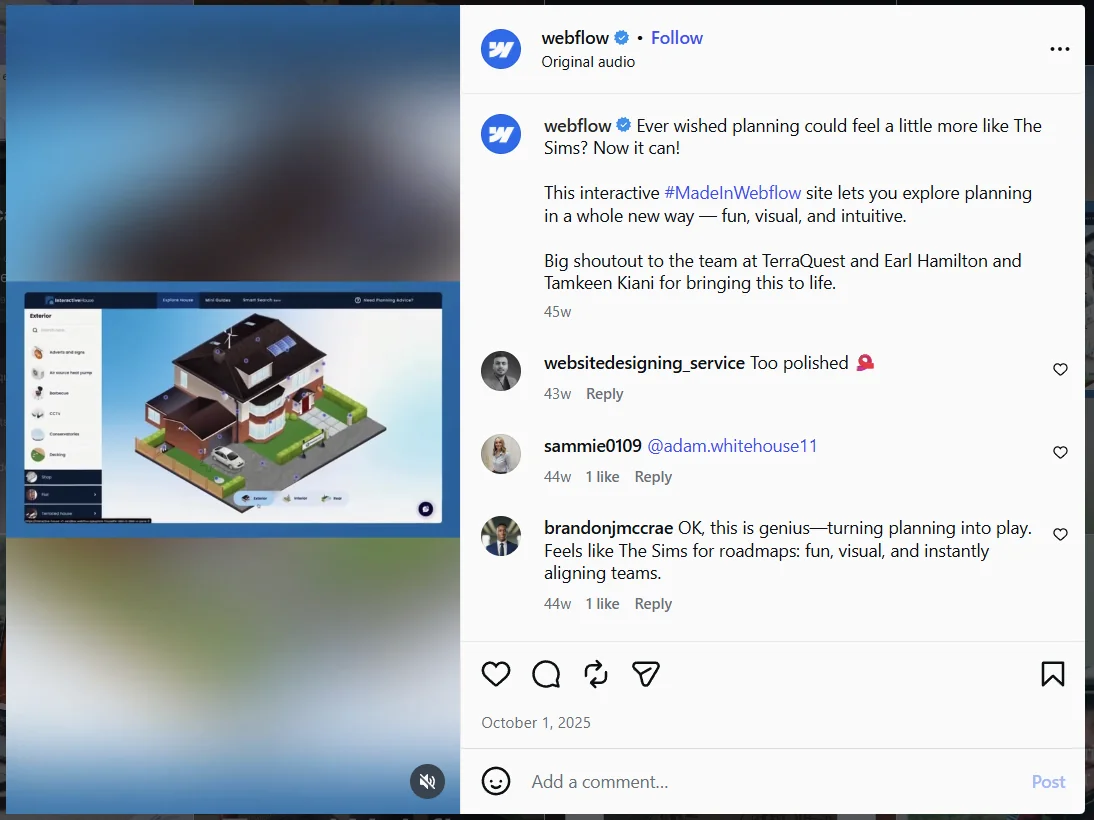
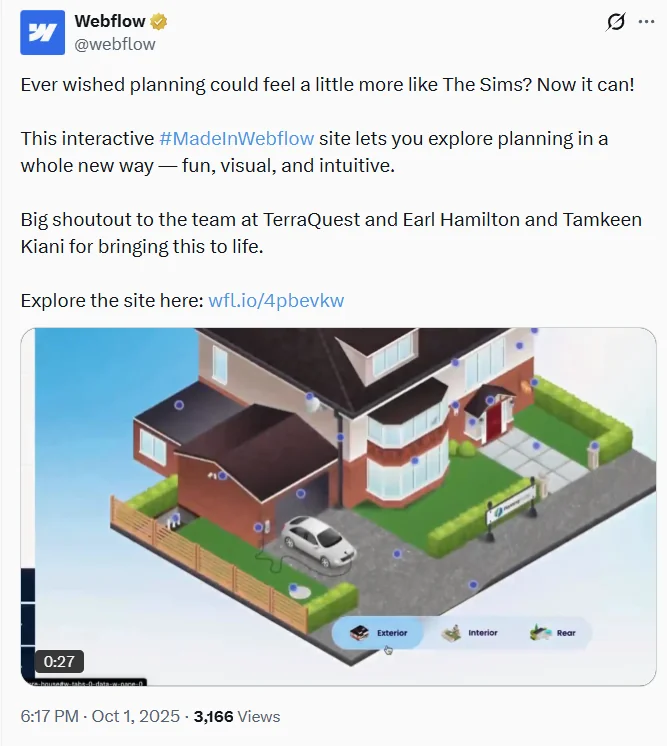
One house, repeated three times
The house types were largely duplicates. Every new type meant more illustrations, navigation and content, for very little new information.
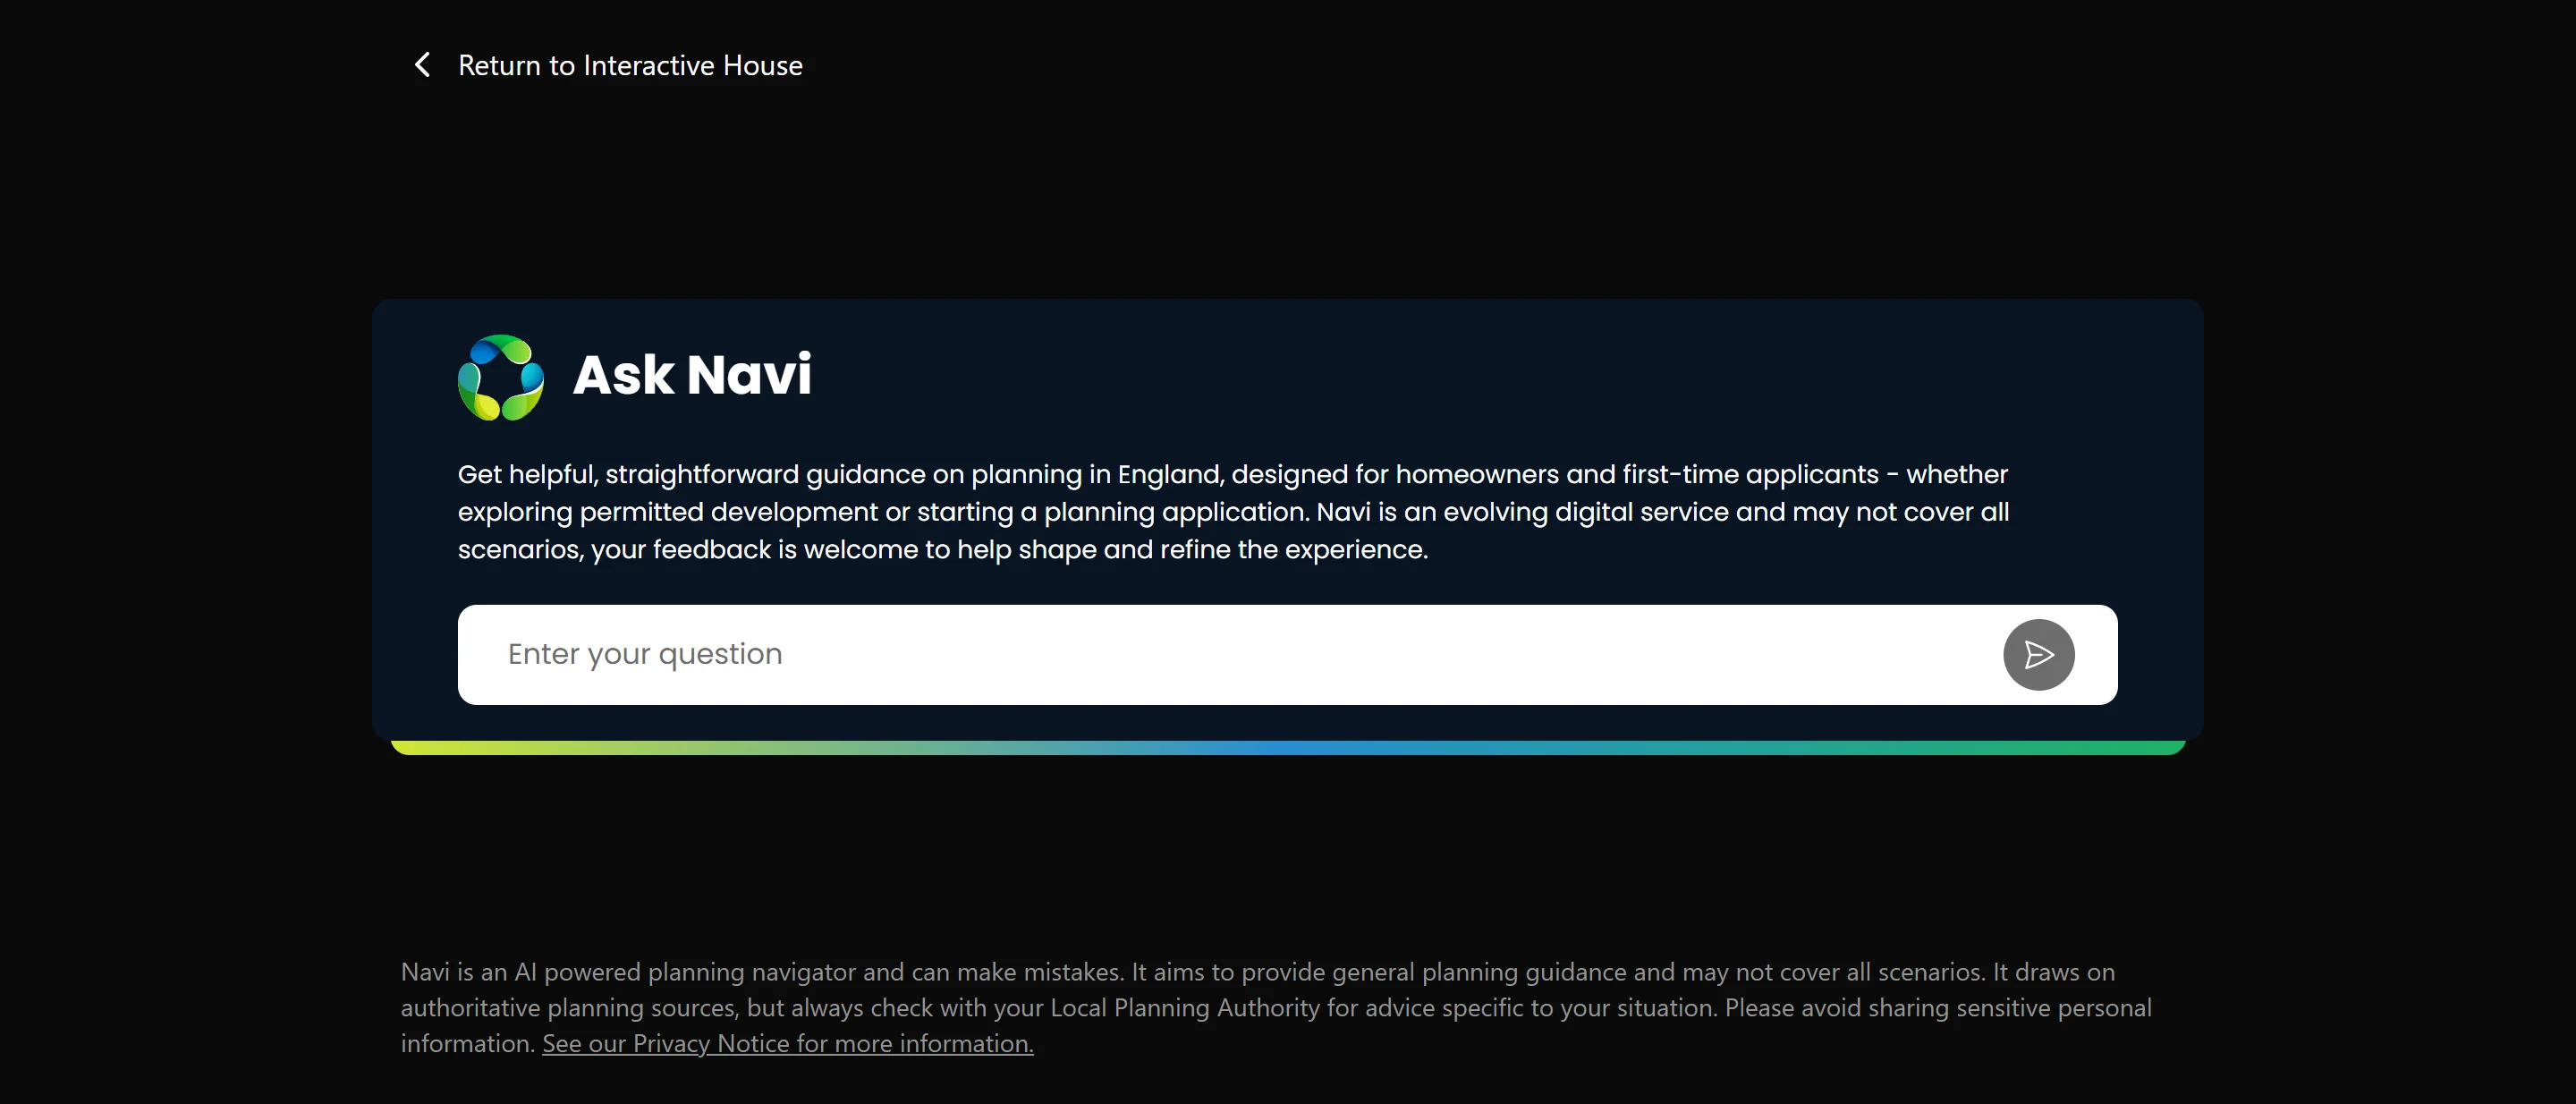
The Interactive House is a tool on the UK Planning Portal that helps people understand what planning permission and building regulations their project needs. Instead of reading long pages of rules, they click around a house, inside and out, and get clear guidance for each part of a home.
The first version had been live since 2016. In 2025 we rebuilt it from the ground up. I led the project end to end, from research, UX and UI to testing and the full Webflow build, working with the Planning Portal content team and a TerraQuest illustrator who created the house artwork.
Before designing anything, we looked at how the existing tool was used. We did five pieces of research.
We reviewed the full Google Analytics history, from 2016 to 2023: about 5M sessions and 35M pageviews.
About 7 pages and just over 3 minutes a session, with a bounce rate of about 25%.
About 30 seconds a page, so they were hunting for an answer rather than reading.
Traffic dips every Christmas, rises every January, and peaked during the 2020 to 2021 home-improvement boom.
The behaviour flow showed where people entered, where they went next, and where they left.
About 60% never saw the homepage. Most sessions started on a topic page or guide, often from a referral link.
The detached house was the default. It was the most common first step by far.
People looped. They kept going back to the homepage and switching house types.
Two big drop-off points: the starting page and the second interaction, each losing about 30% of sessions.
We broke down January 2022 to June 2023 by house type, touch point, guide, device and traffic source.
About 25% of users opened more than one house type, and they looked for the same touch points each time.
Mini guides (about 200K views) drew about as much traffic as touch points.
Demand was very uneven: about 45K views for extensions and additions, but about 1K for radiators, decking and floors.
About 95% of users were on desktop.
Referral links brought in about 45% of traffic, and TerraQuest’s own sites about 35%. Web search brought in only about 20%.
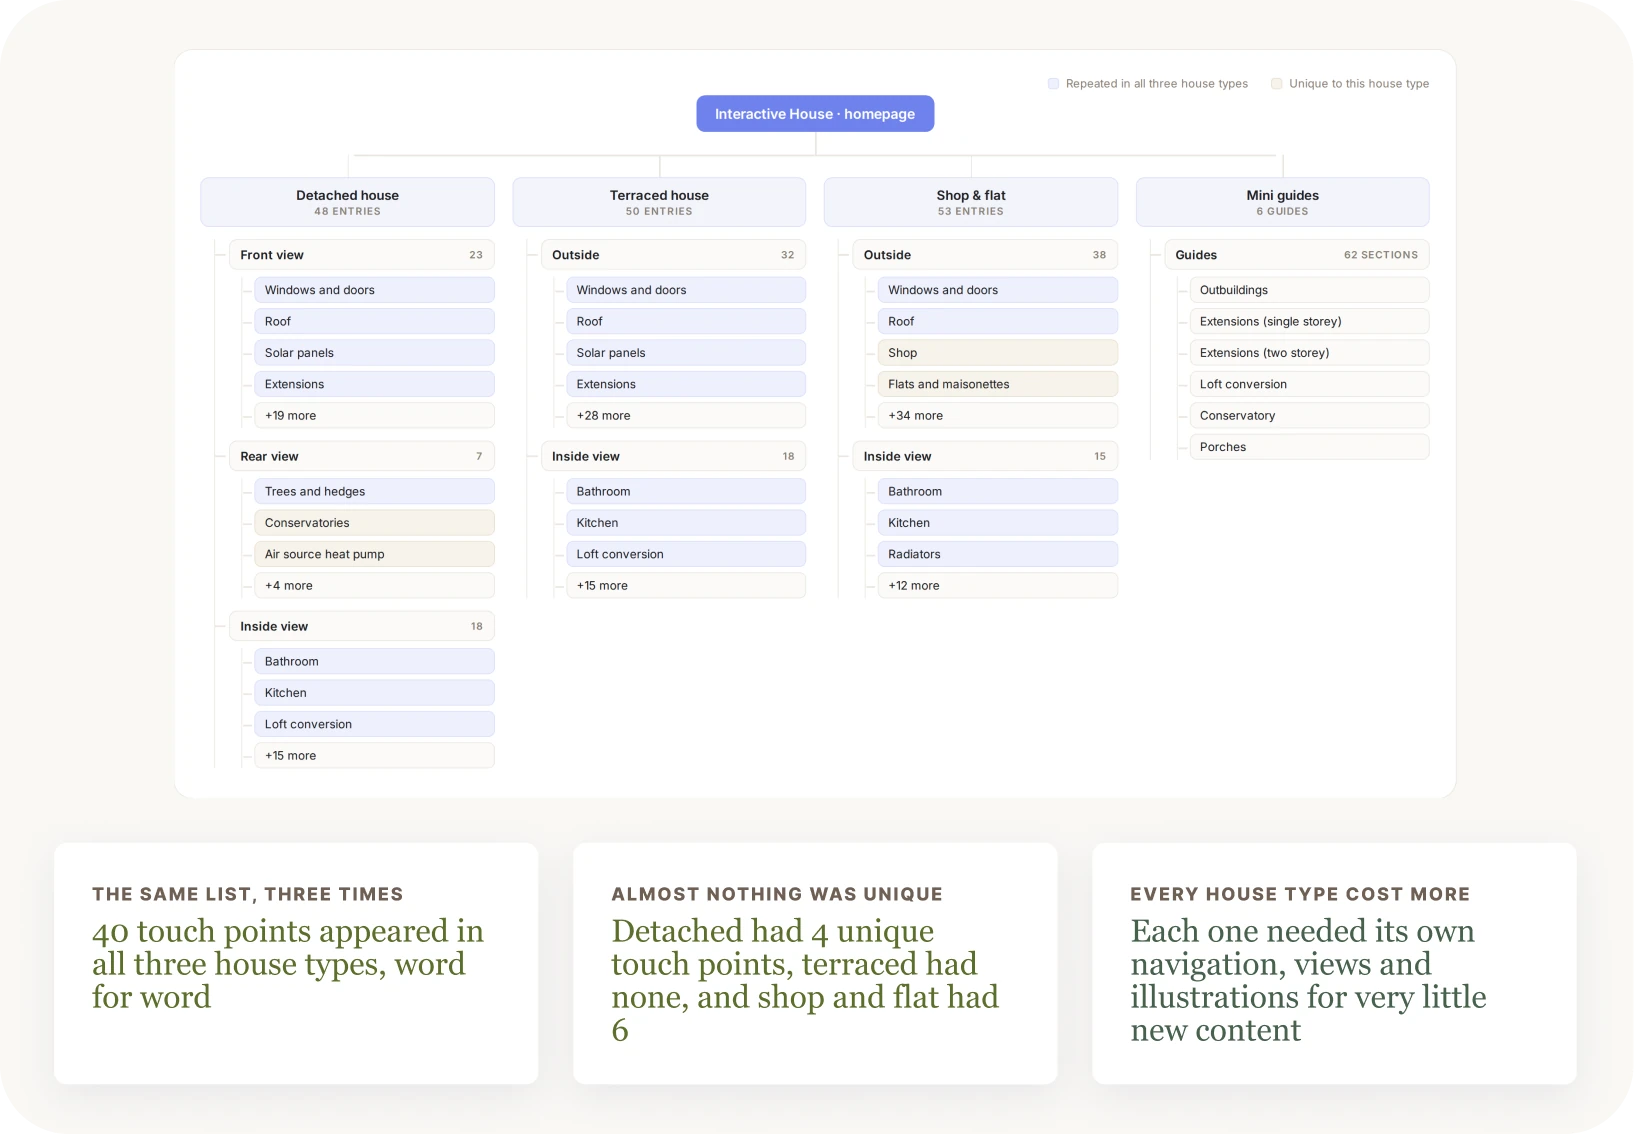
We mapped every page and touch point on the old site.
40 touch points were repeated in all three house types.
Beyond those, the detached house had just 4 unique touch points, the terraced house had none, and the shop and flat had 6.
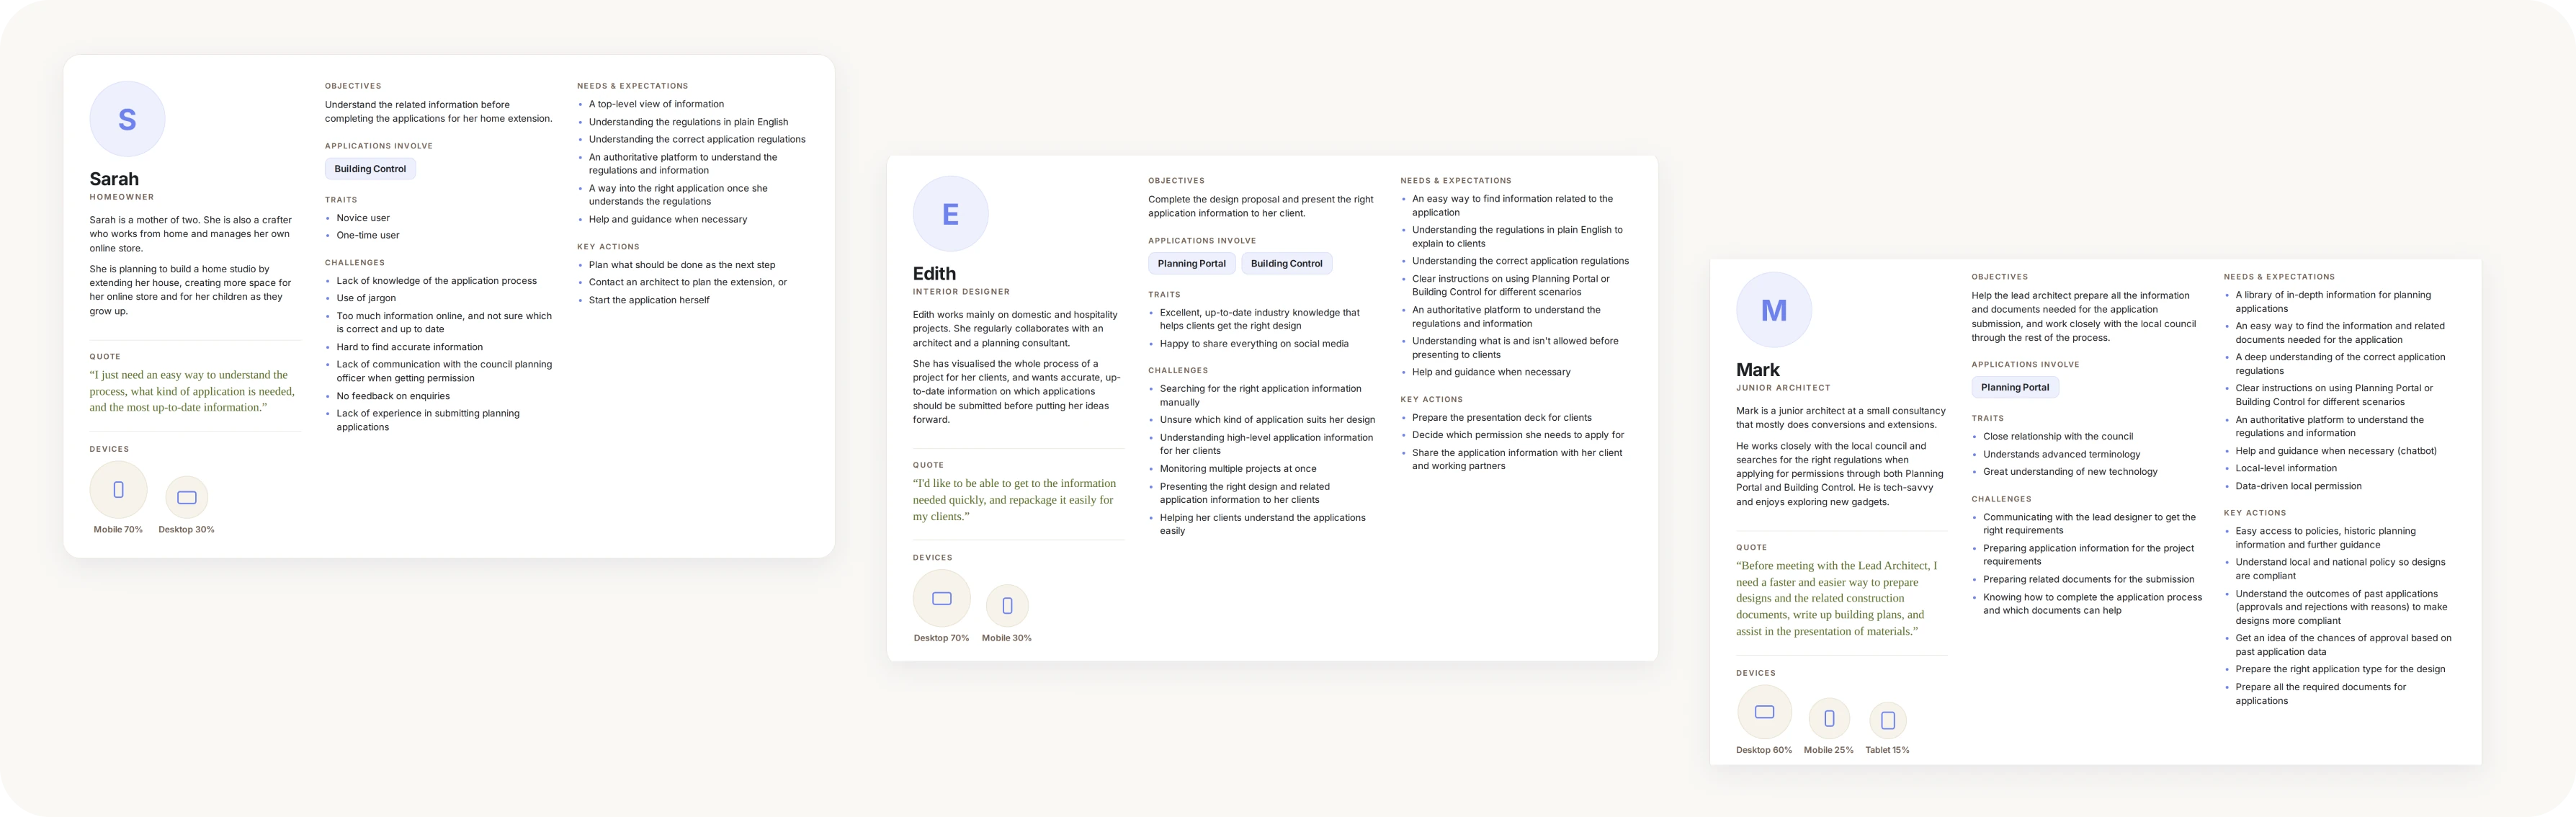
We built three personas from user research and stakeholder knowledge. Together they span the full range of people using the tool.
The personas expected heavy mobile use, especially for homeowners, but the analytics showed about 95% desktop. We treated that number as a symptom, not the truth: the old site wasn’t usable on a phone, so mobile users never showed up. The rebuild had to be fully responsive and a year after launch, about 40% of users are on mobile.
The initial research on existing data helped us refine the challenges and decide what to fix.
One house, repeated three times
The house types were largely duplicates. Every new type meant more illustrations, navigation and content, for very little new information.
Built for one audience, used by many
The tool was written for homeowners, but the traffic and personas showed a much wider audience: first-time users need plain English, professionals need depth and speed. The same tool had to serve both.
No front door
Most people arrived deep in the site, so every page had to work as a starting point.
Locked out on mobile
A tool for people standing in their own homes barely worked on a phone.
Constraints
Keep the advertising space that funds the service
Keep existing referral links working
Build to WCAG 2.1 AA
We answered each challenge with one core decision.
One core house
One core house covering about 90% of the content. Touch points unique to other property types move into a sub-navigation, and one shared CMS model powers every property type and guide.
More than one way in:
Click the house or search a list. Planning and building rules sit side by side on every topic.
Self-contained pages:
Every touch point and guide makes sense on its own, wherever someone lands.
Responsive from the start
Designed for phones from the beginning, with touch-friendly points on small screens.
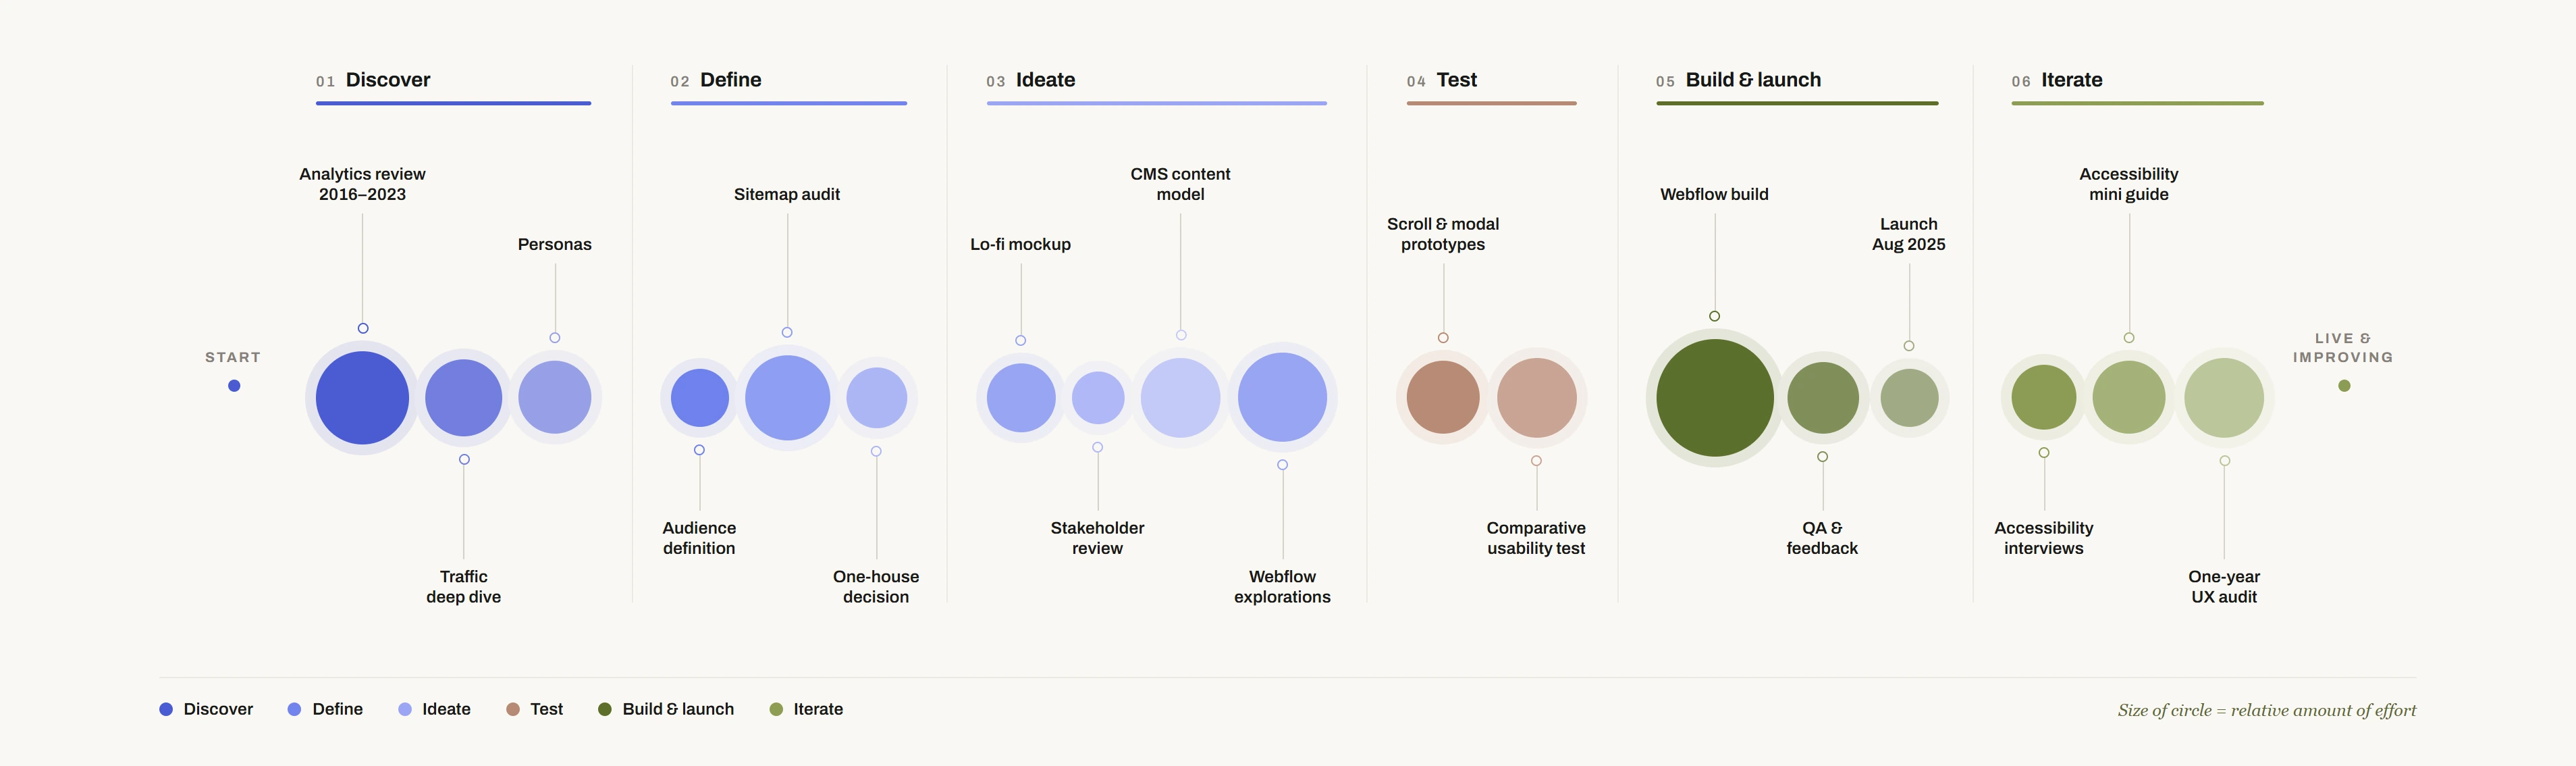
Six phases, overlapping in practice, with testing feeding back into design more than once.
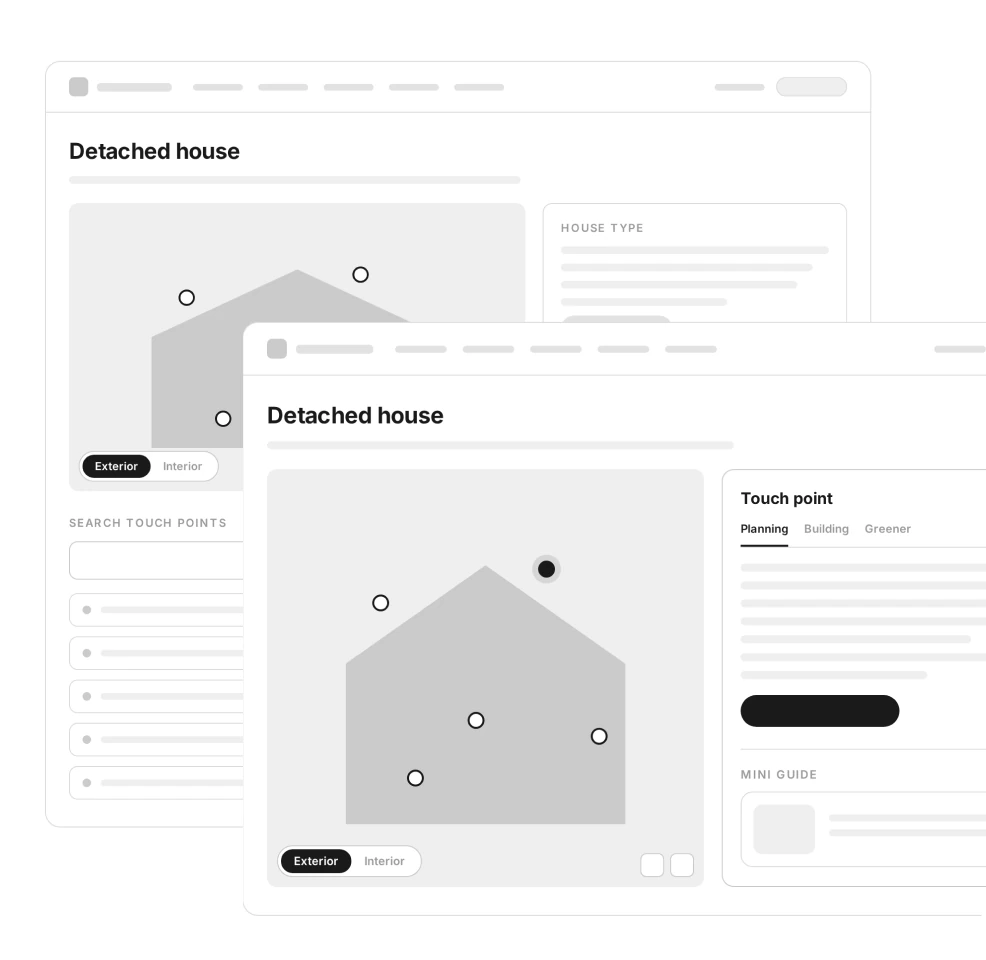
We sketched the detached house page first. Every page then followed the same path: lo-fi mockup → review → Webflow build → test.
The wireframe set the core patterns: interior and exterior views, clickable points on the house, a searchable touch point list, and Planning and Building tabs.
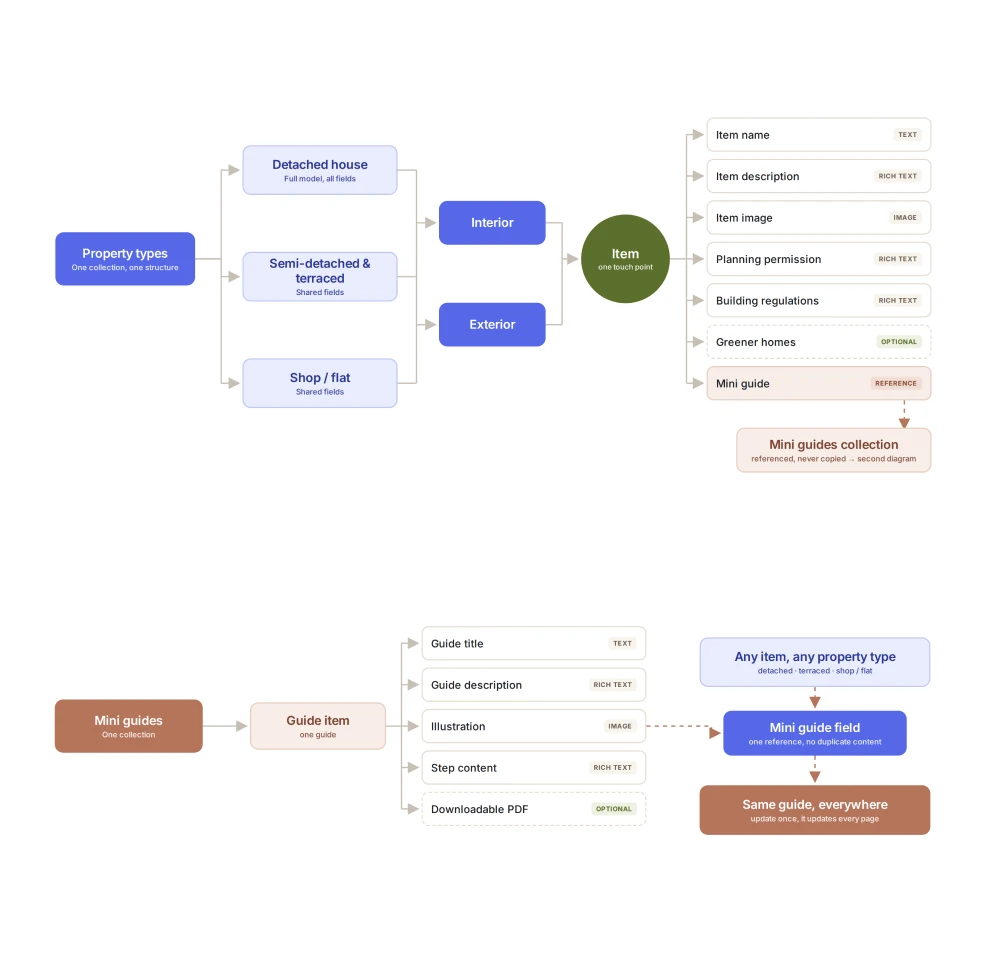
We designed one CMS structure shared by every property type: item name, description, image, planning permission and building regulations, plus optional greener homes and mini guide links.
That is what later made it possible to add a whole new guide with no new navigation, no new illustrations and no developer time.
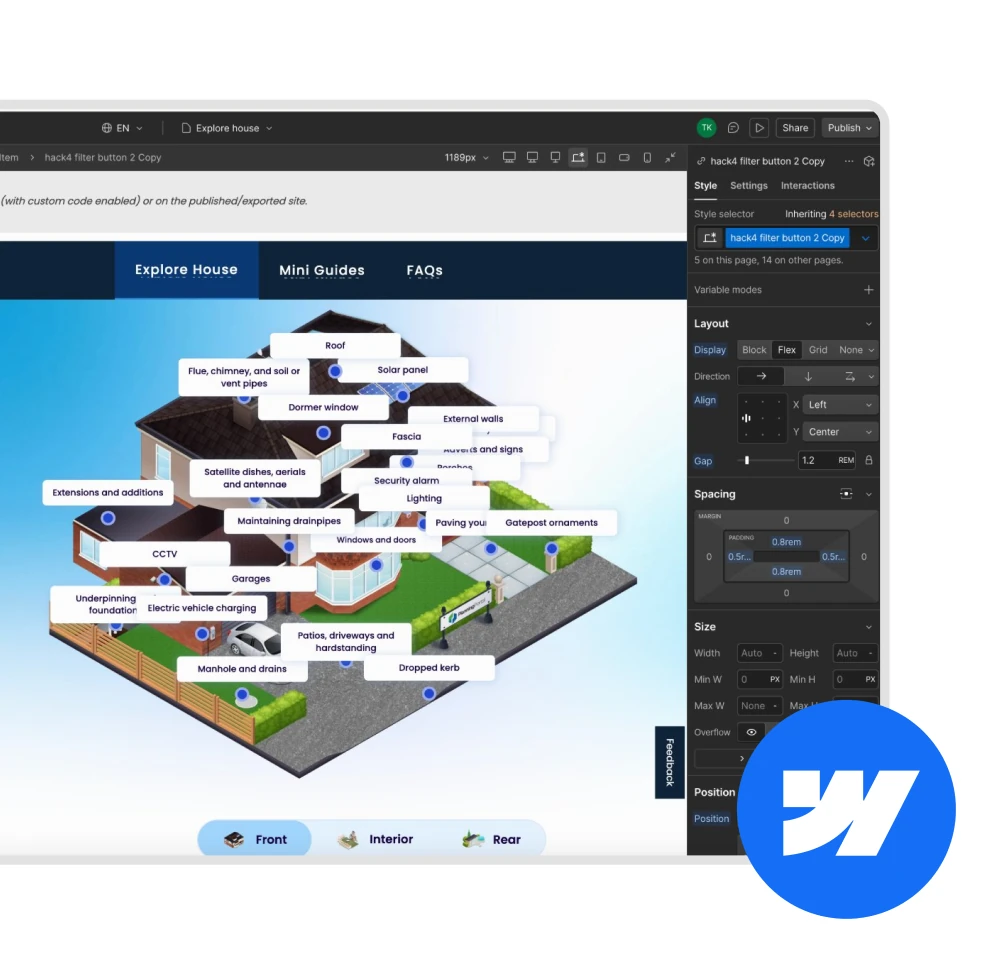
We explored layouts directly in Webflow rather than in static mockups, because the interaction was the main thing we were designing.
That raised the key design question: when someone clicks a point on the house, where should the content appear?
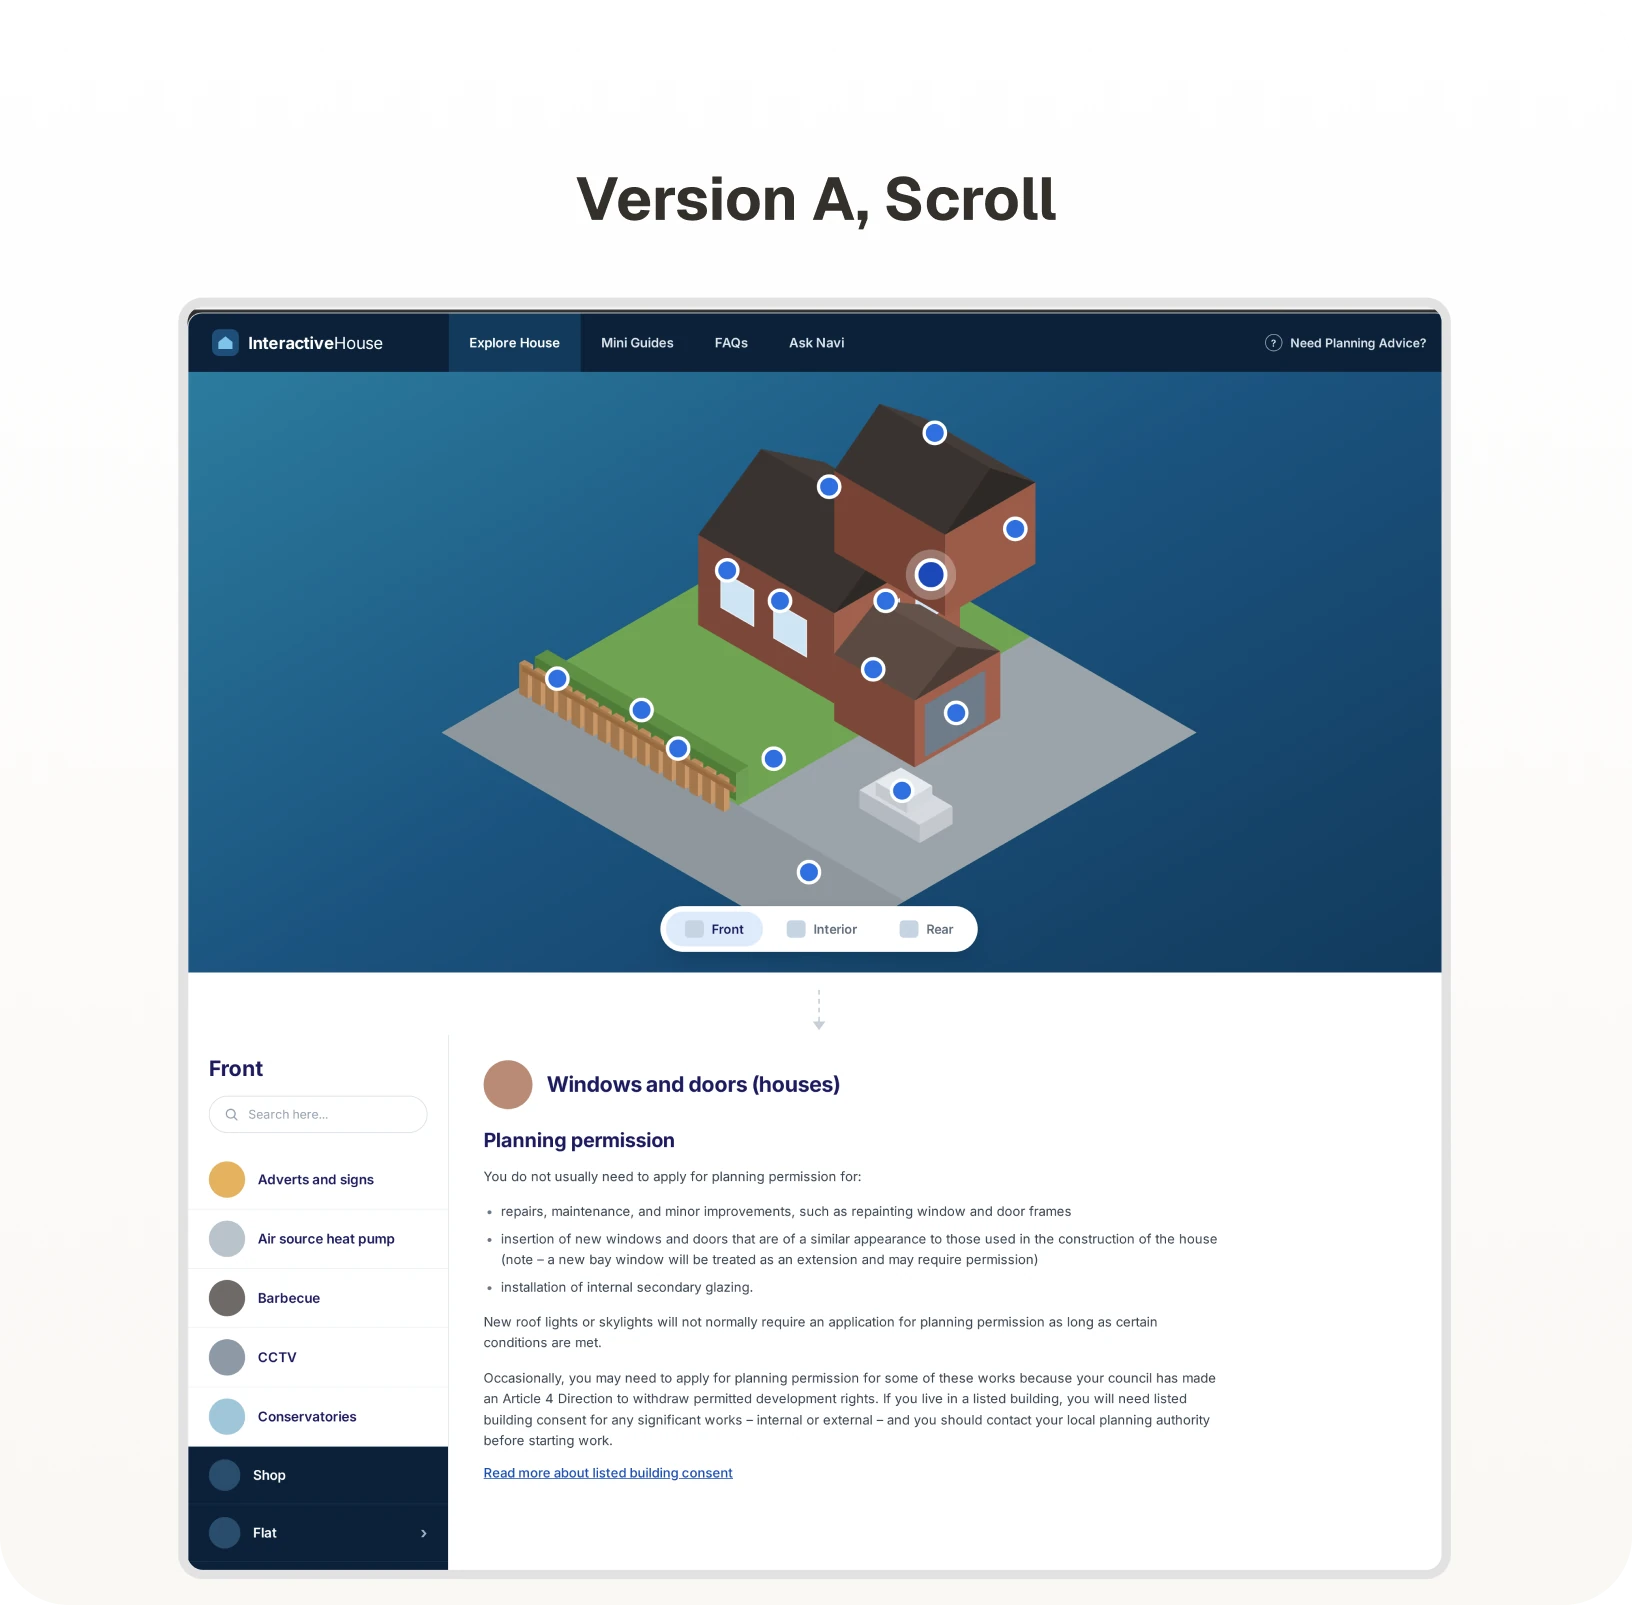
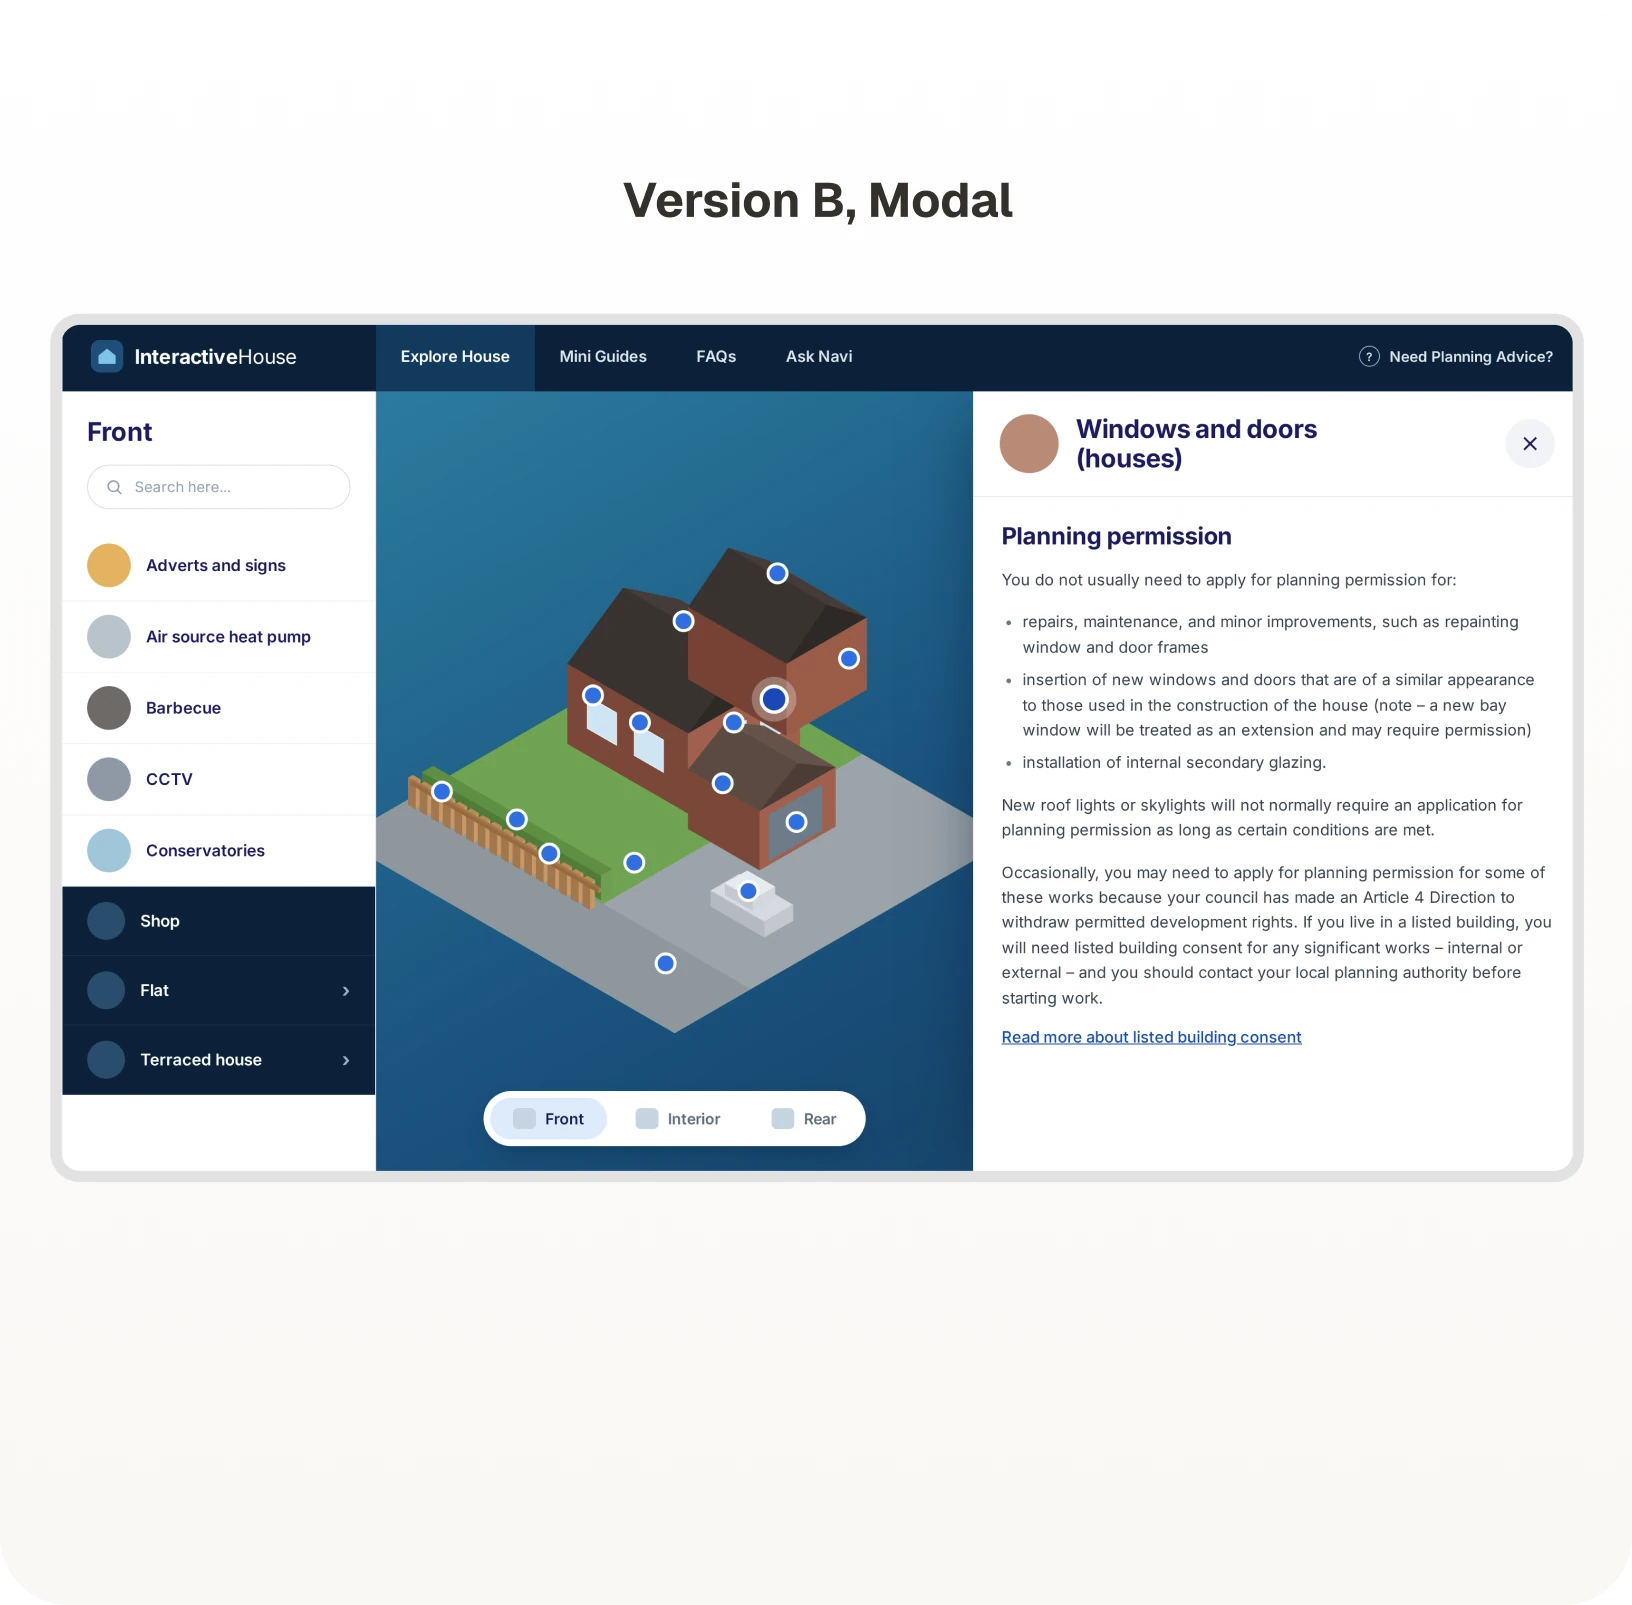
We built two working prototypes and ran moderated tests with 7 participants.
Version A, Scroll: clicking a point scrolls down to the content.
Version B, Modal: clicking a point opens a pop-up next to the house.
Decision: we chose the modal, because it kept people in context with the house, and paired it with the searchable touch-point list so there is always a second route. The small-screen and navigation concerns became build requirements.
Participants used each version to find the planning permission guidance for a heating element and for the bathroom, then compared the two.
Result: 4 of 7 preferred the modal.
“Point and click and then the information pops up alongside it. I think it does make sense to have that interactivity.” (P2)
“I’m using my mouse a lot across the page… now I need to go and click again and click again.” (P3, on the modal)
For the modal: it felt connected to the house and kept everything on one screen.
For scrolling: it was easier to move between items and felt less overwhelming.
Both groups asked for search as a shortcut, and worried about many small points on a phone.
Eight stages in Webflow, in the order they happened. Everything in the build comes from the research or the testing: each decision is there because we found something that needed it.
The route
Designing and building in one place meant no hand-off gap: a decision made in testing went straight into the product, and the prototype people tested became the thing that shipped.
Lo-fi layouts for the house, the guidance and the routes between them, worked out before anything was styled.
What it does
What the finished build gives the Planning Portal team, as opposed to how it got there.
CMS-driven.
The shared content model powers every property type and guide, so the Planning Portal team adds and updates content without a developer.
Interactions & animation.
Clickable points, modals, view switching and guide animations make the house easy to explore.
Accessible.
Designed to WCAG 2.1 AA, with keyboard, contrast and screen-reader support throughout.
Ad-ready.
Run-of-site and contextual placements built into the layout without competing with the guidance.
Links preserved.
Existing referral traffic from councils and architects keeps landing in the right place.
Eight screens from the live tool. Each one answers something the research or the testing turned up.
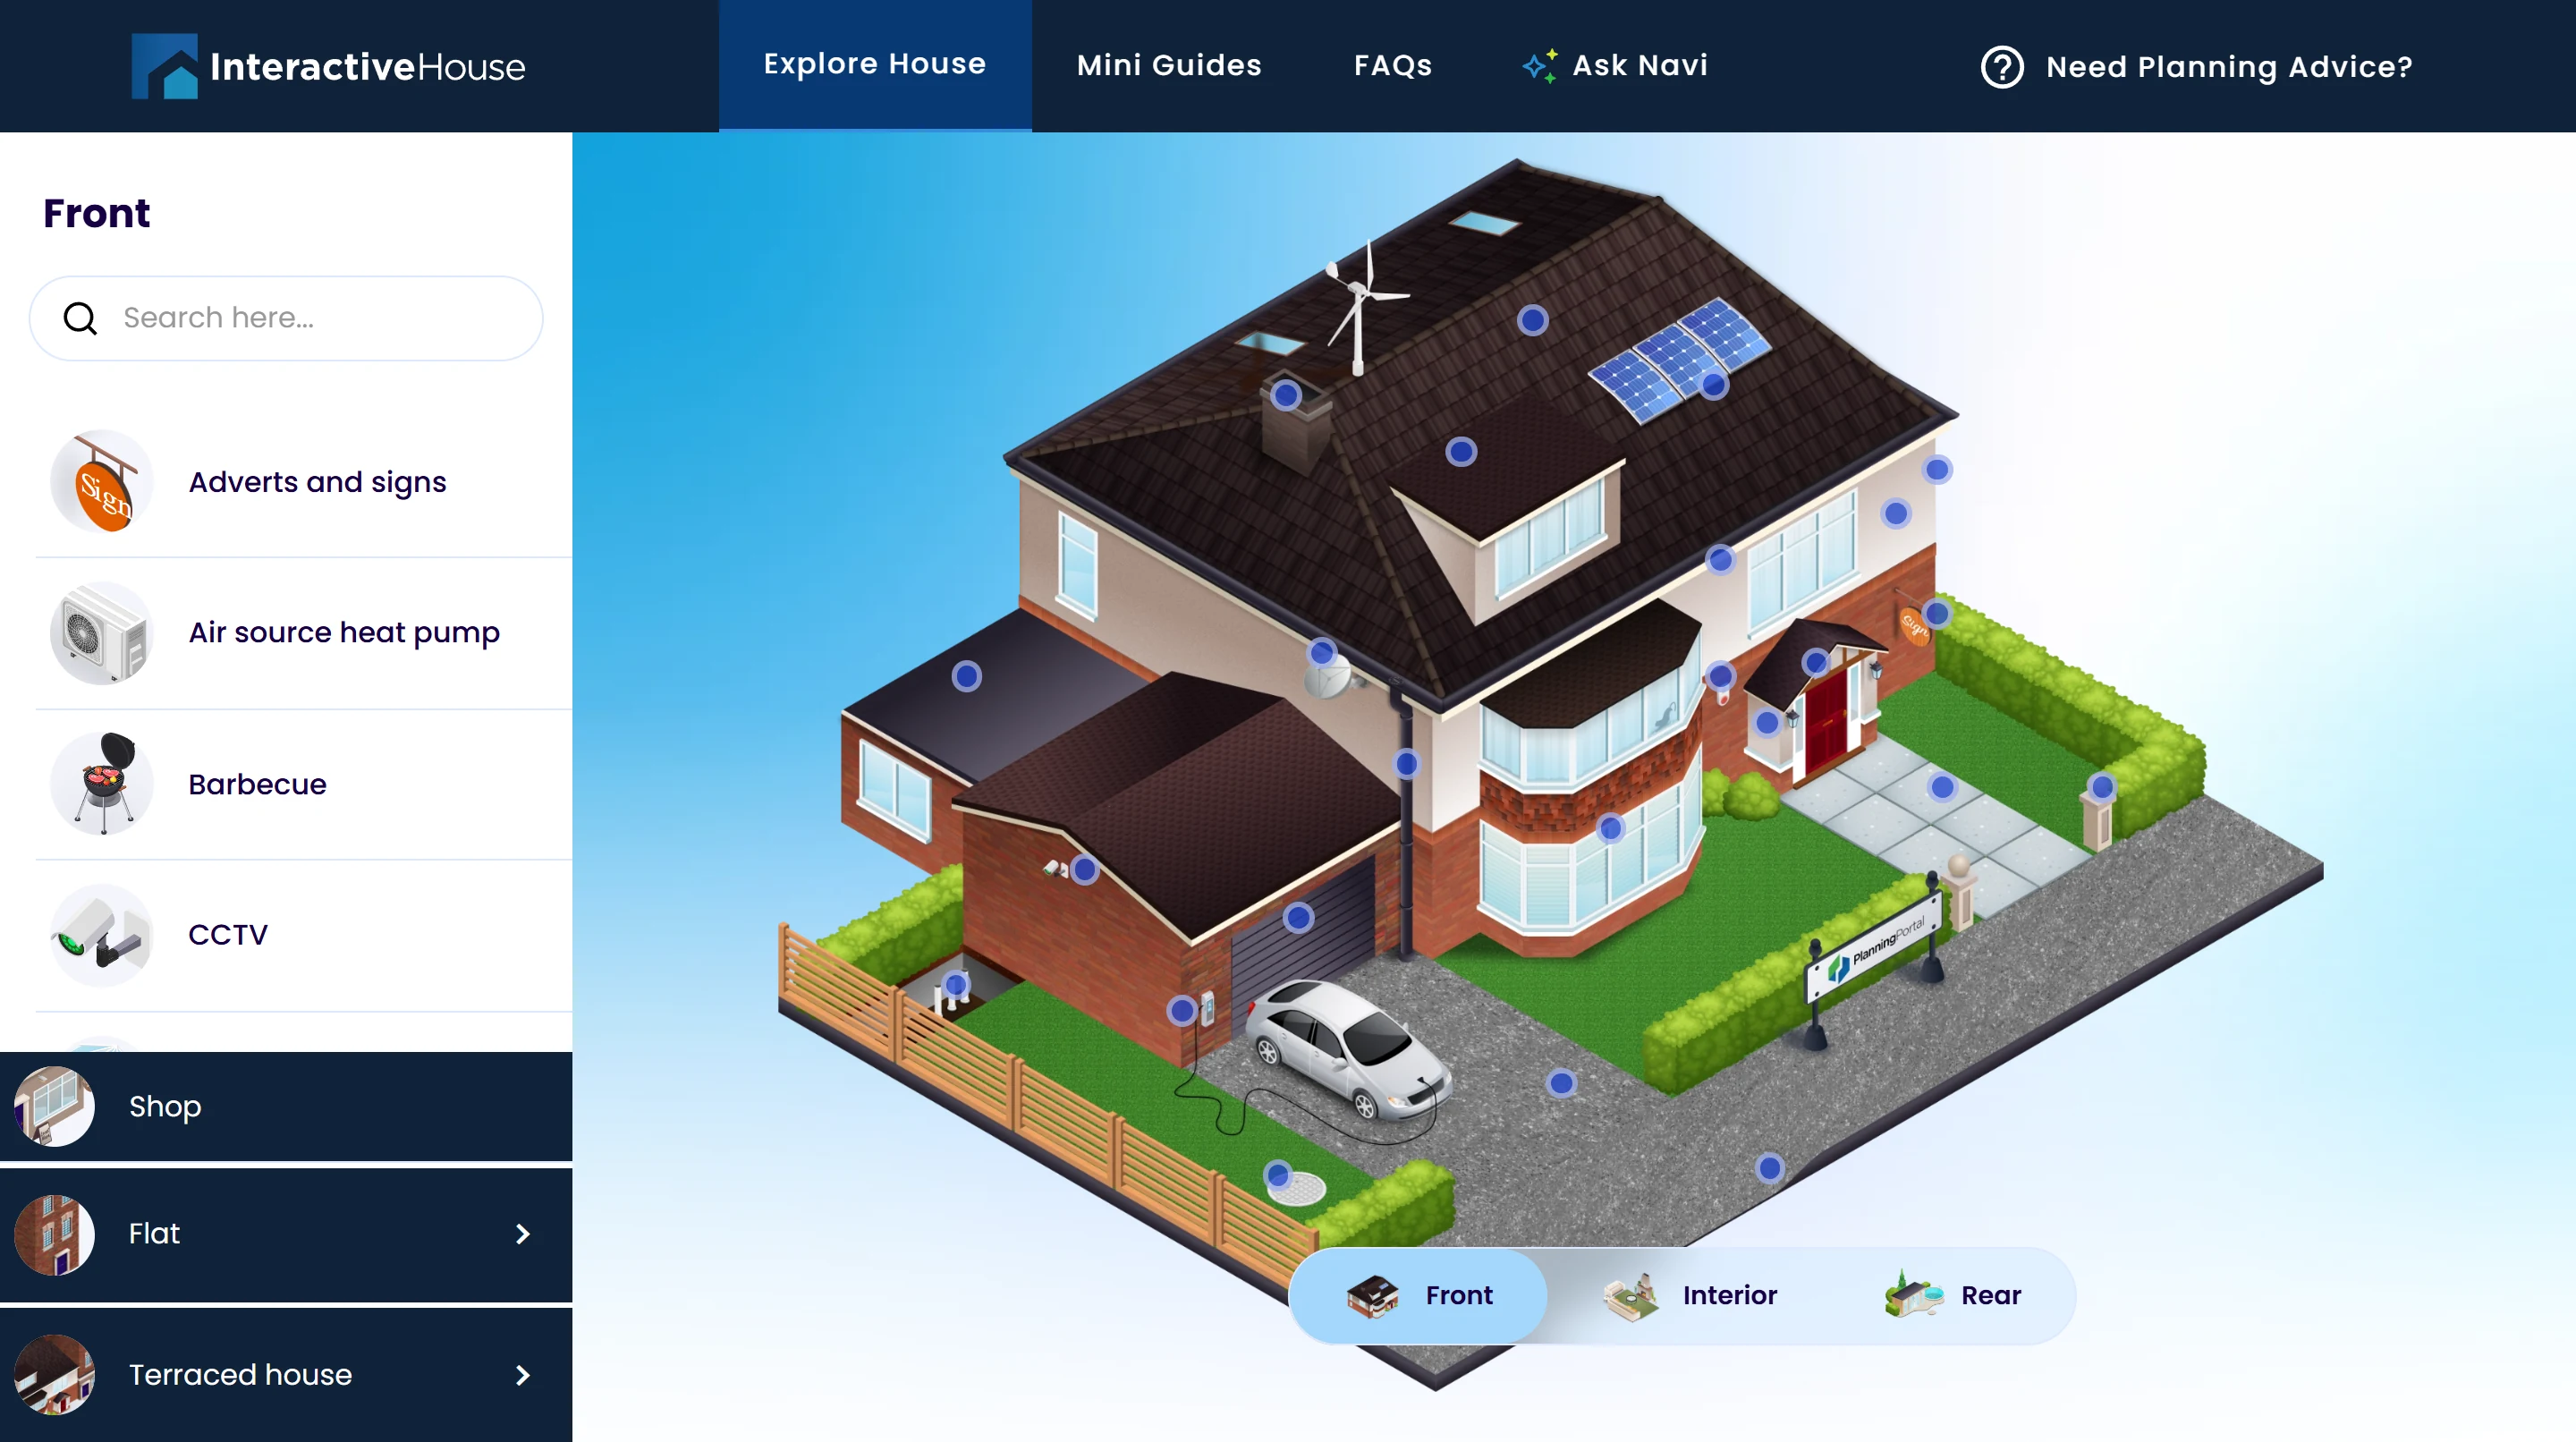
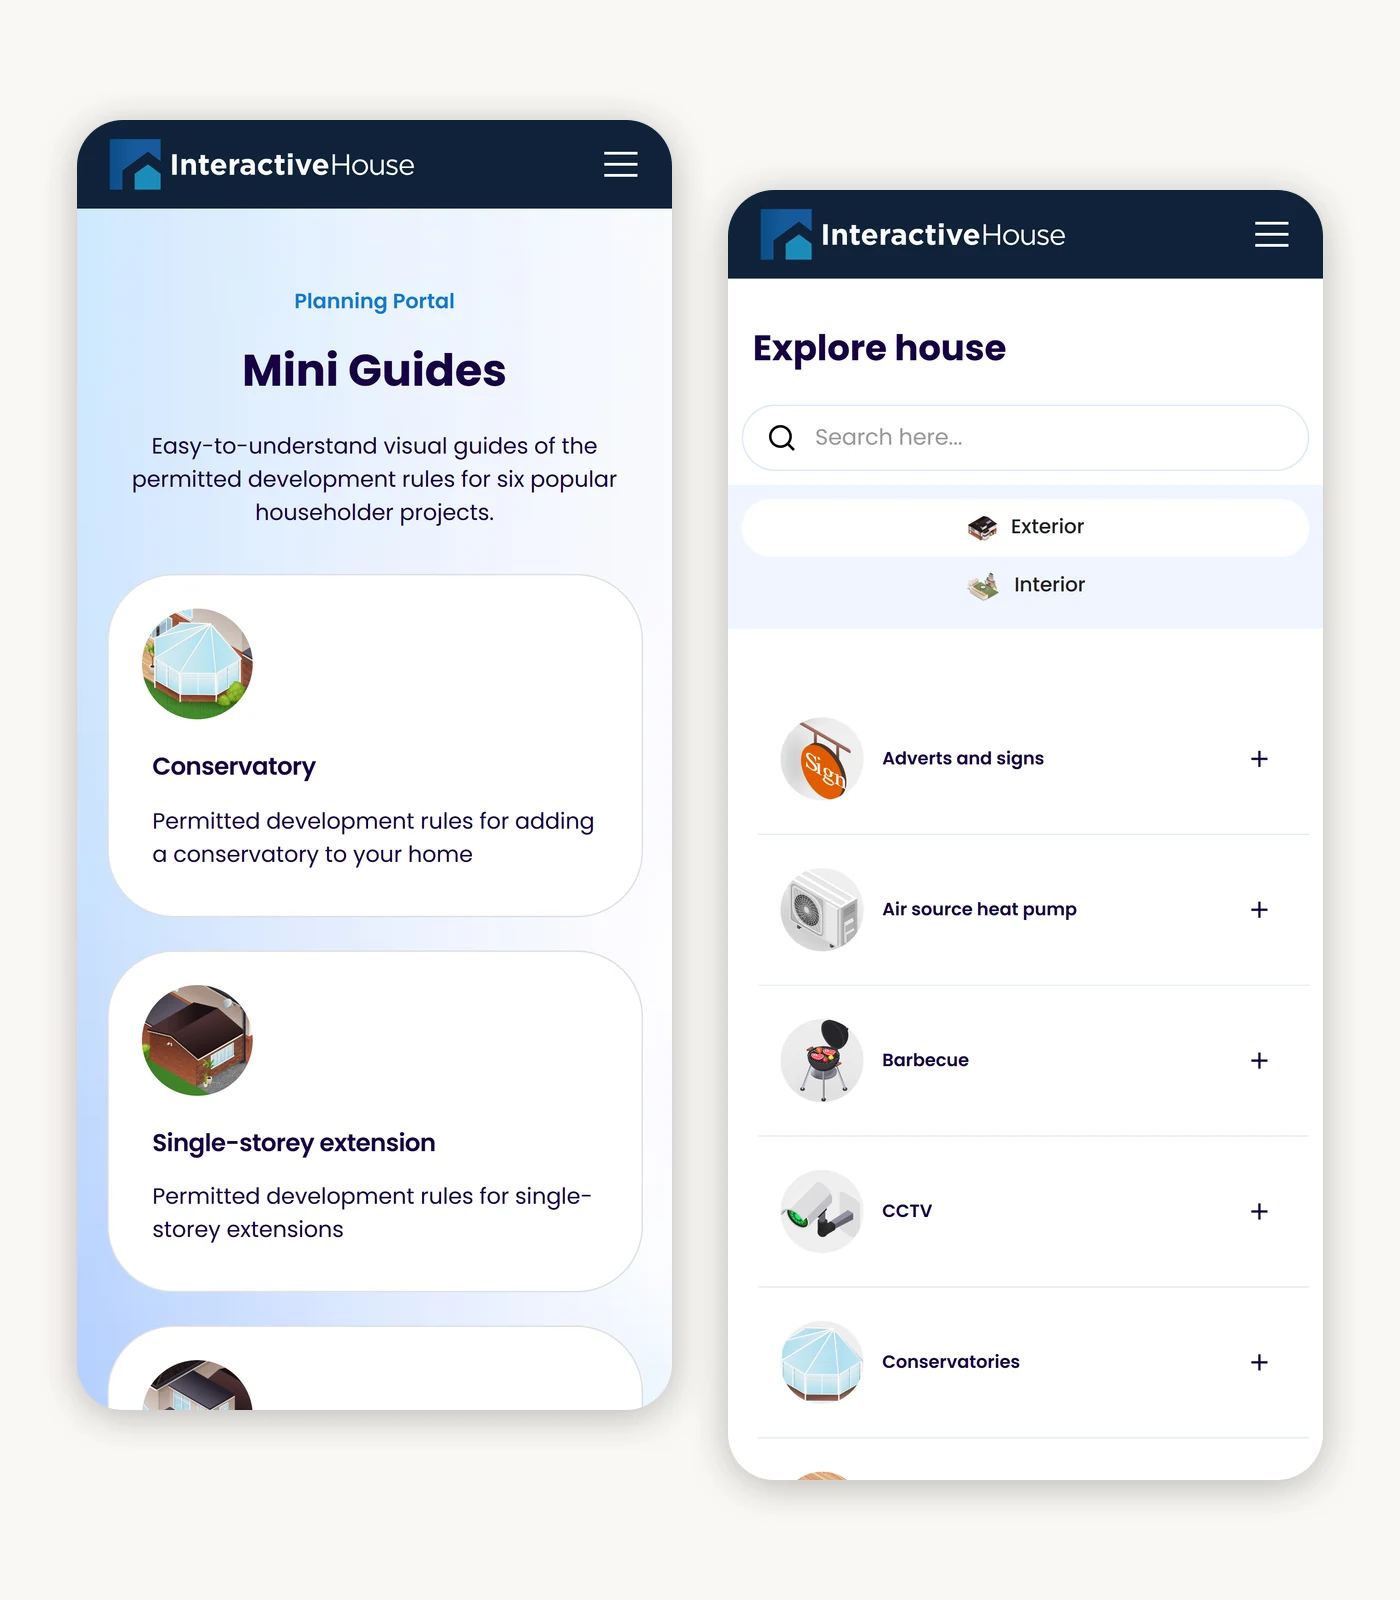
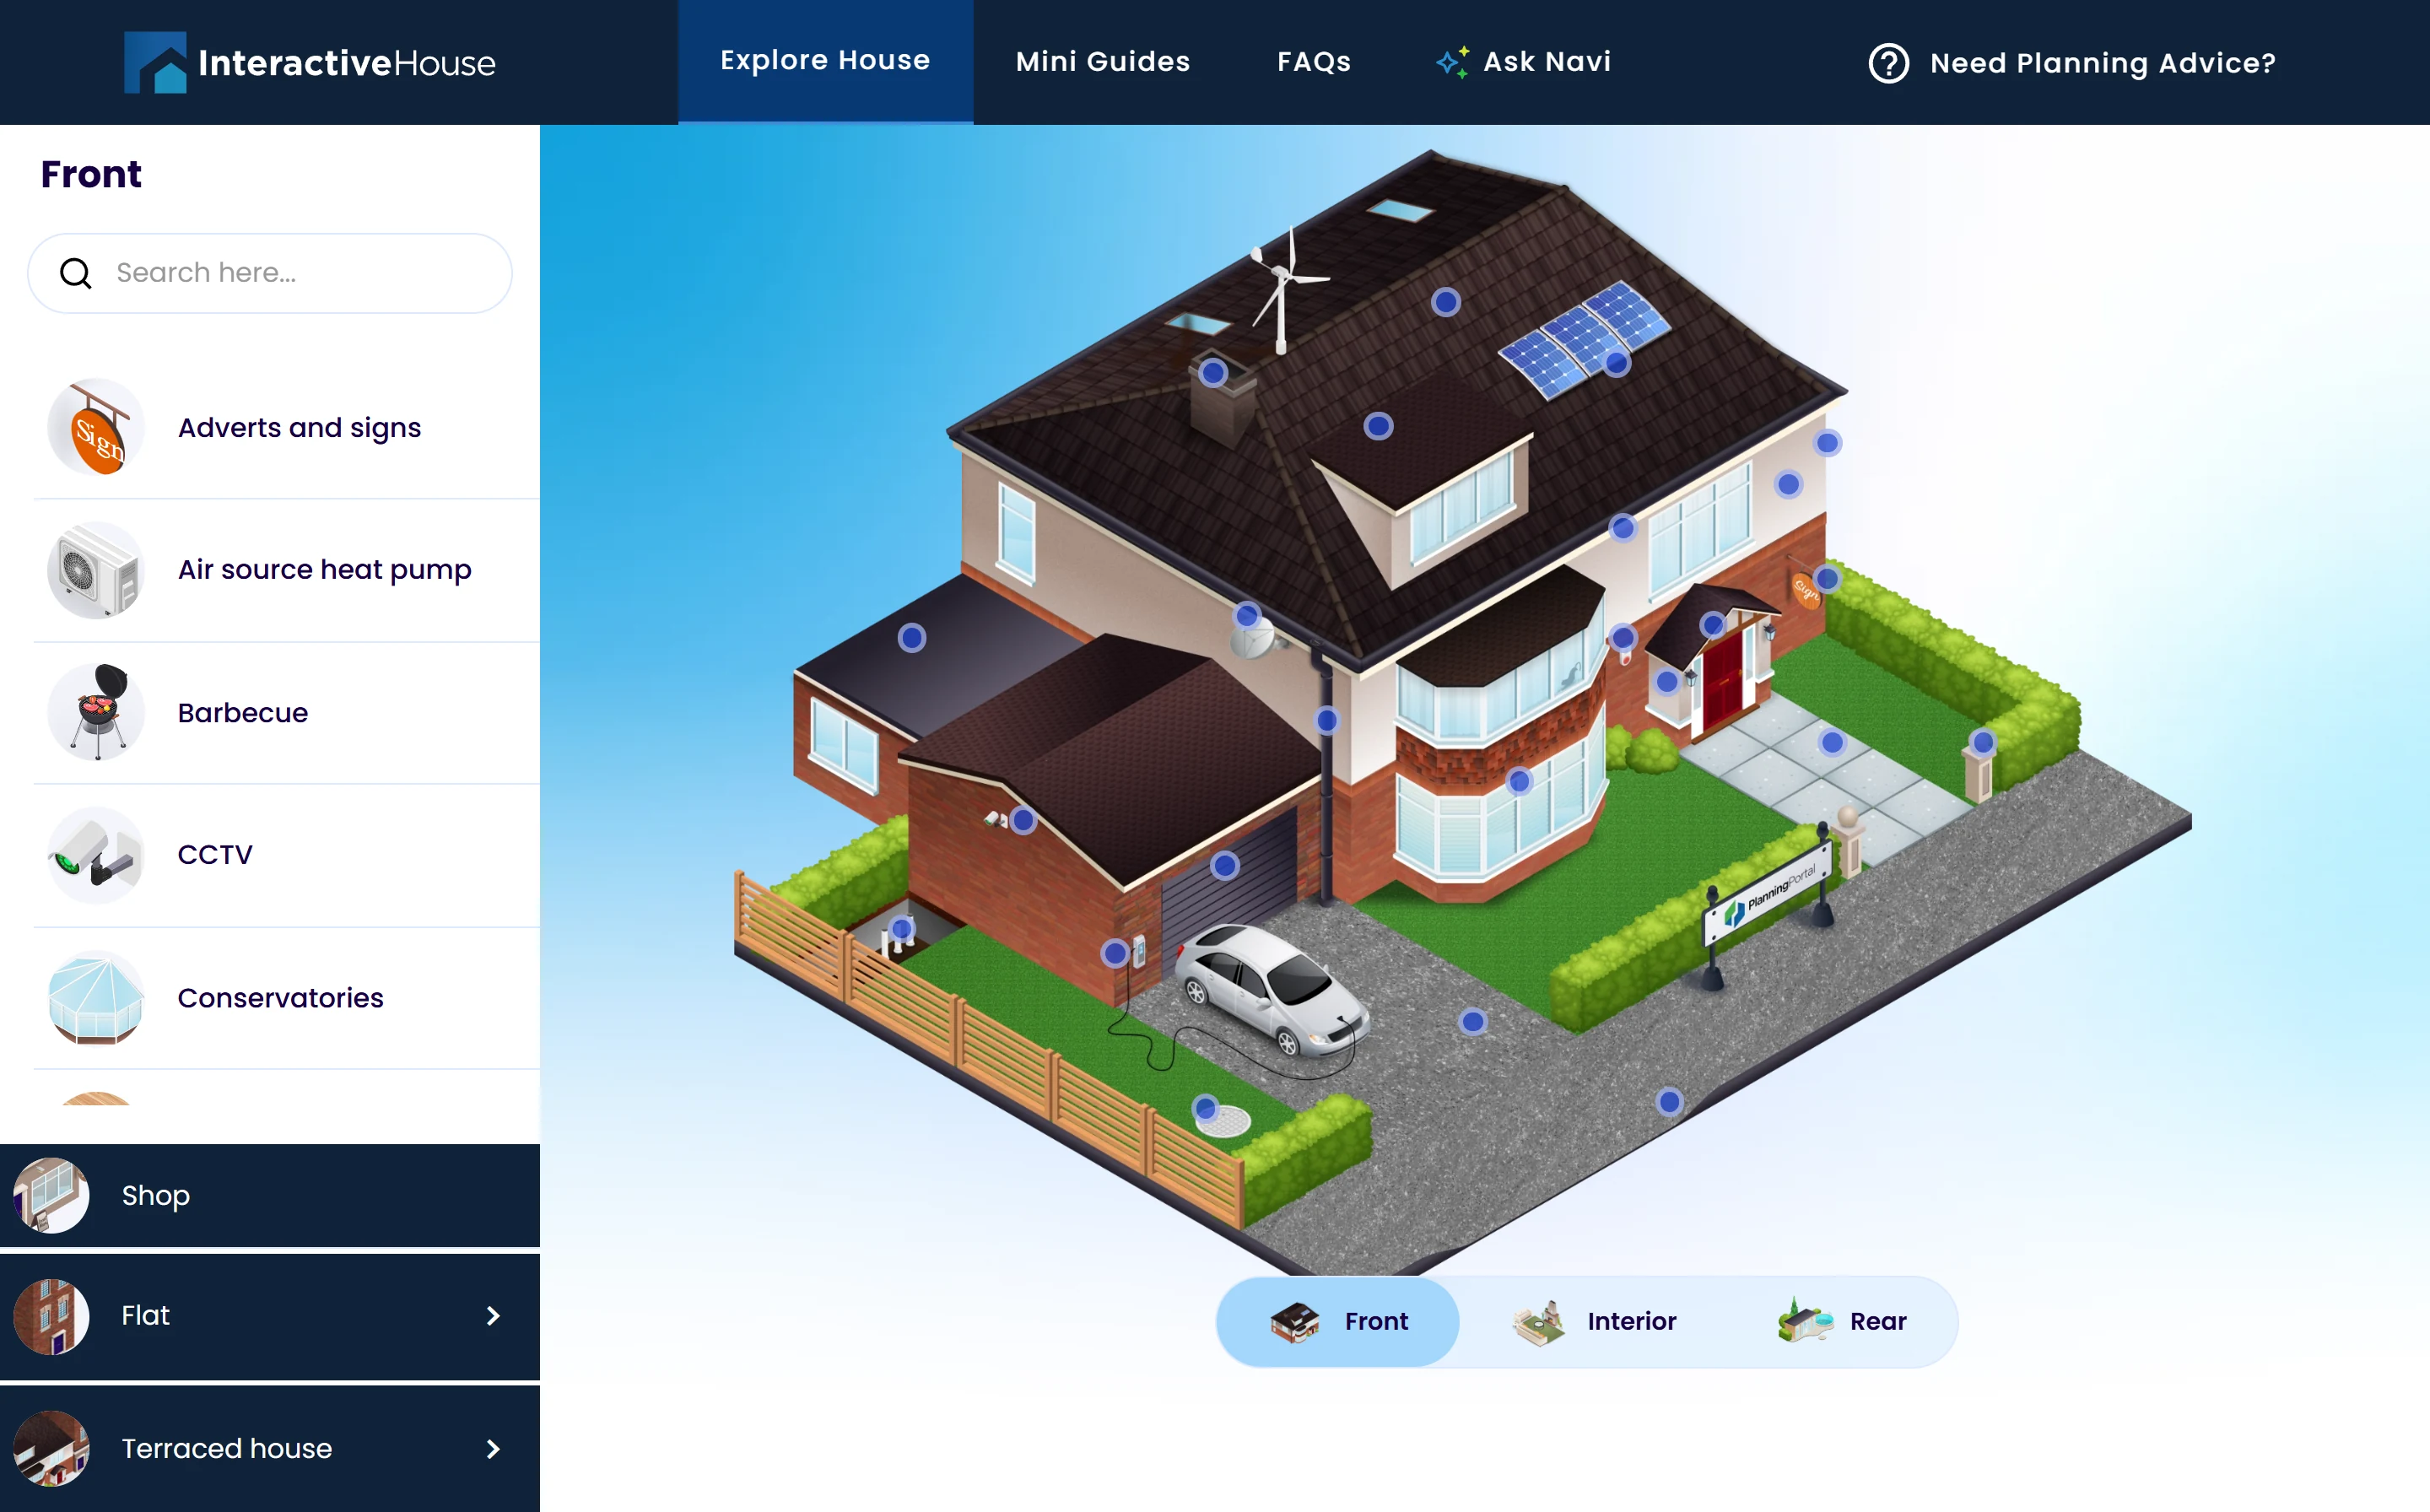
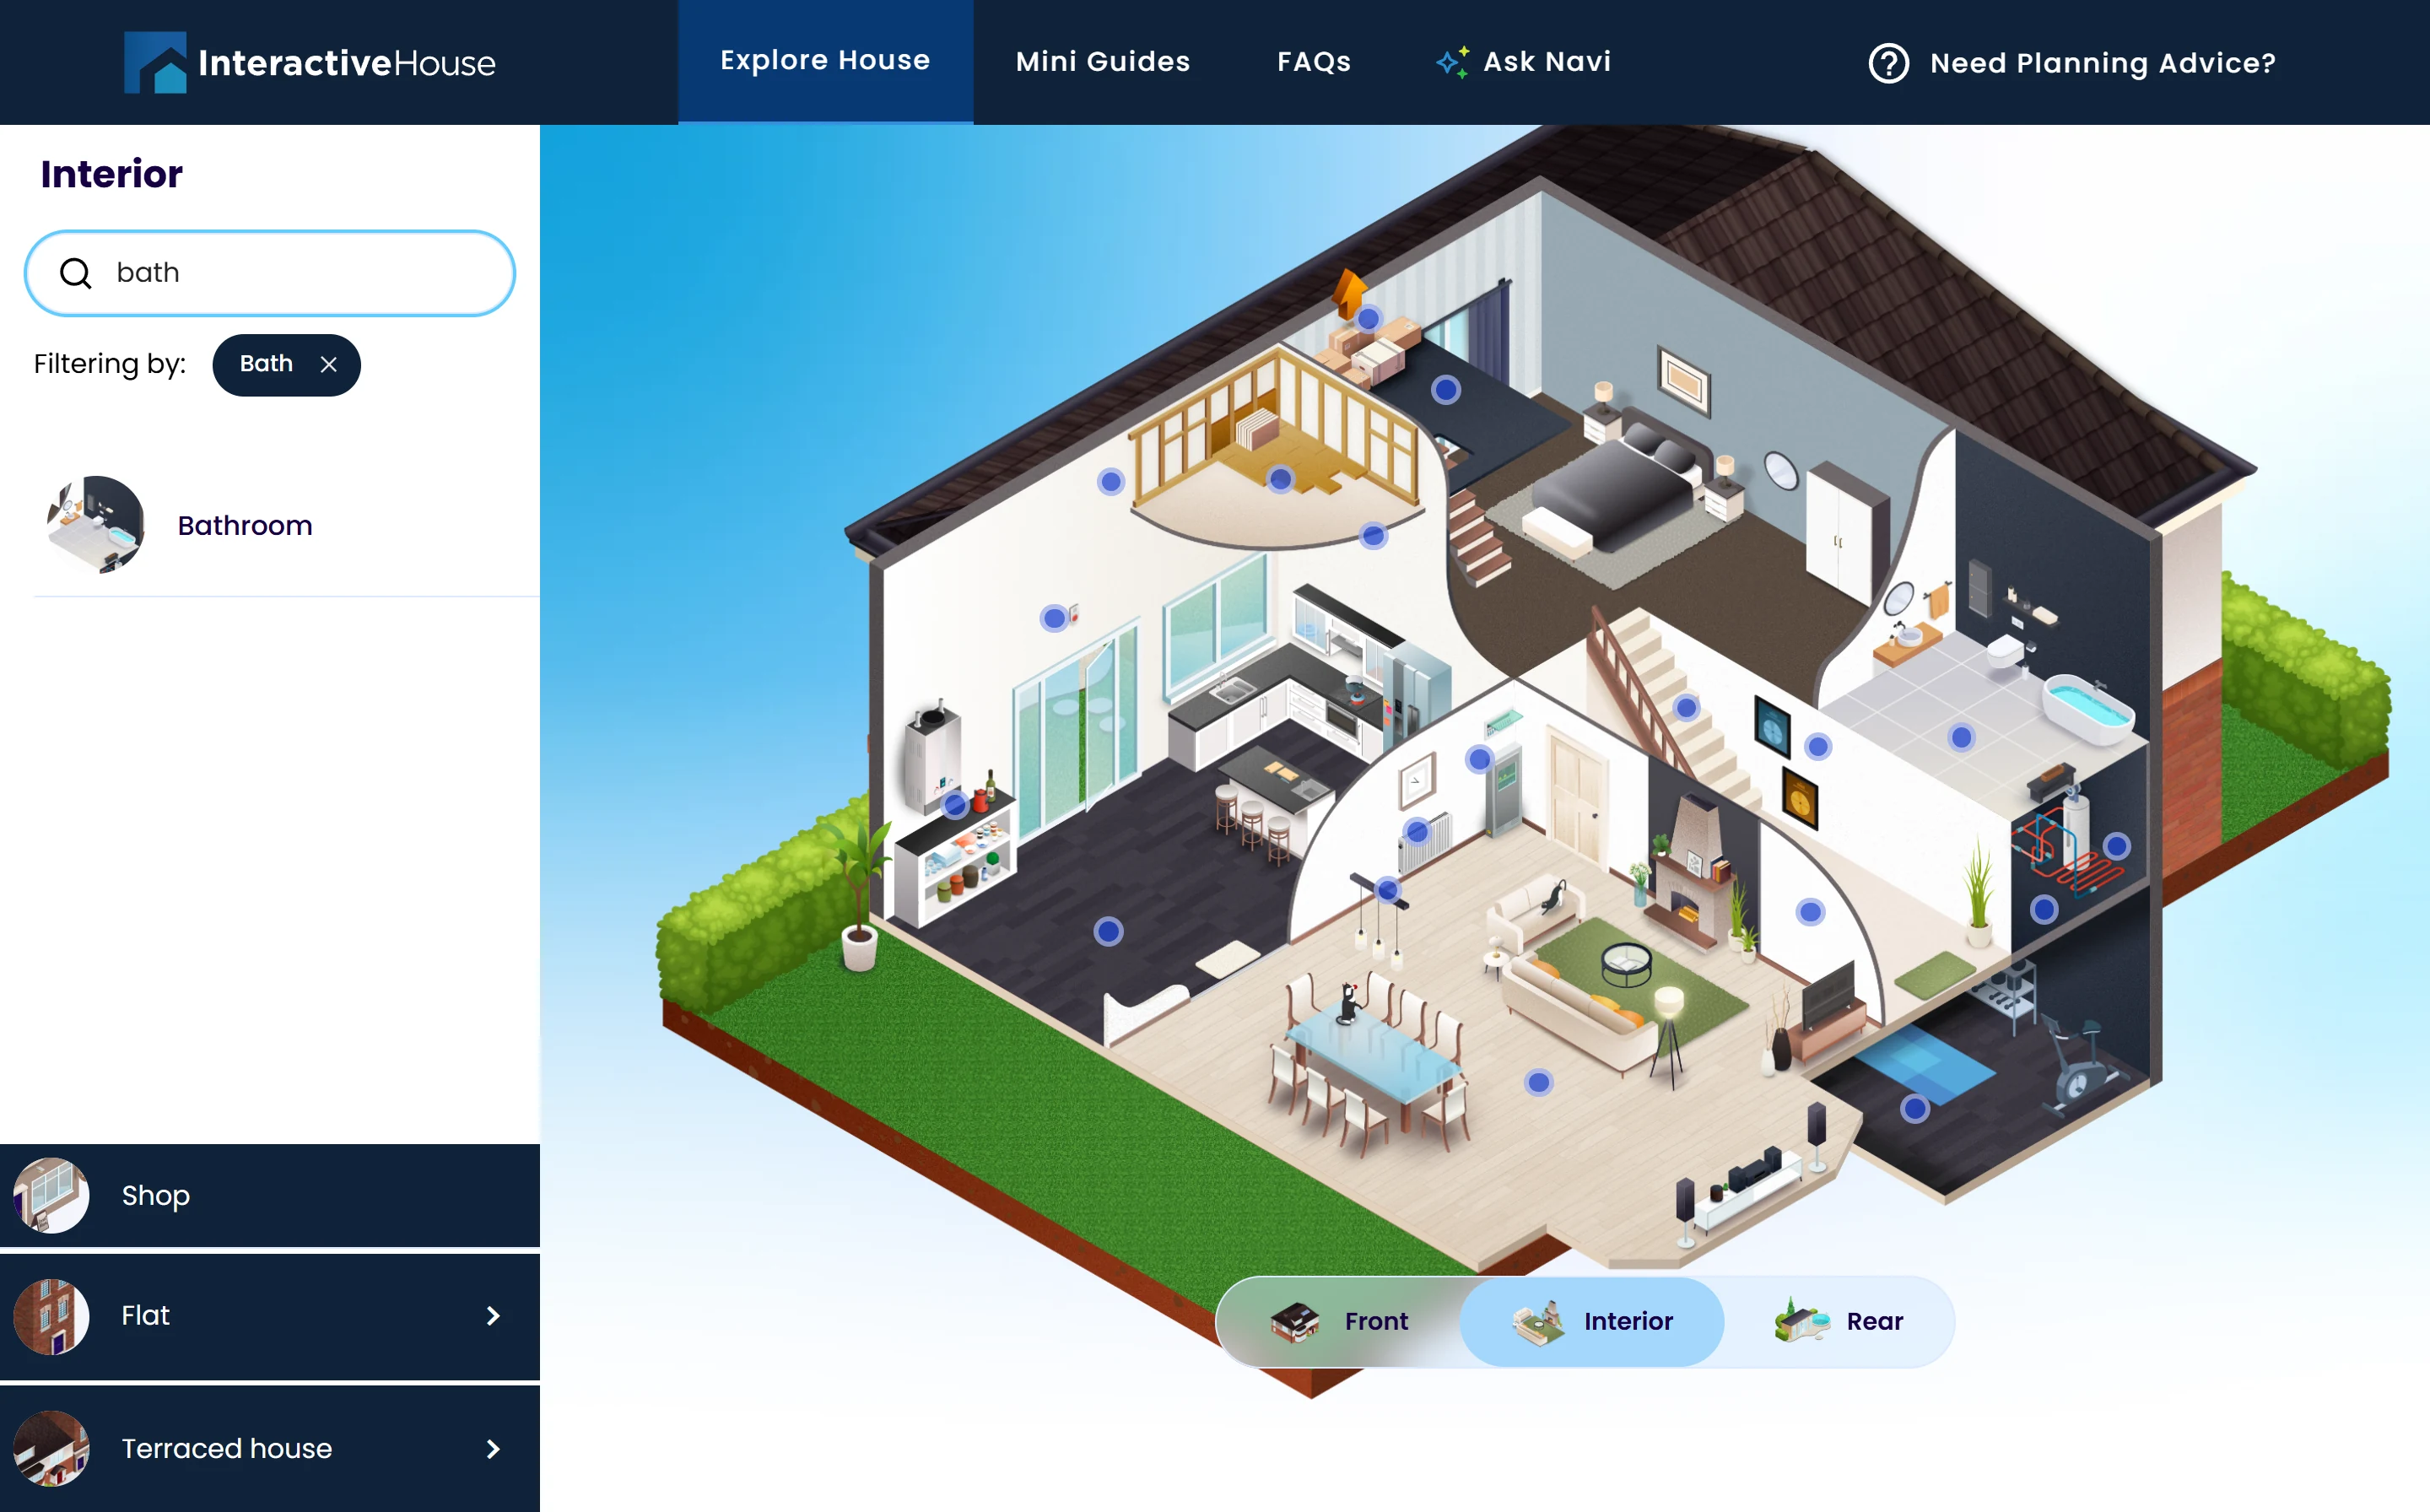
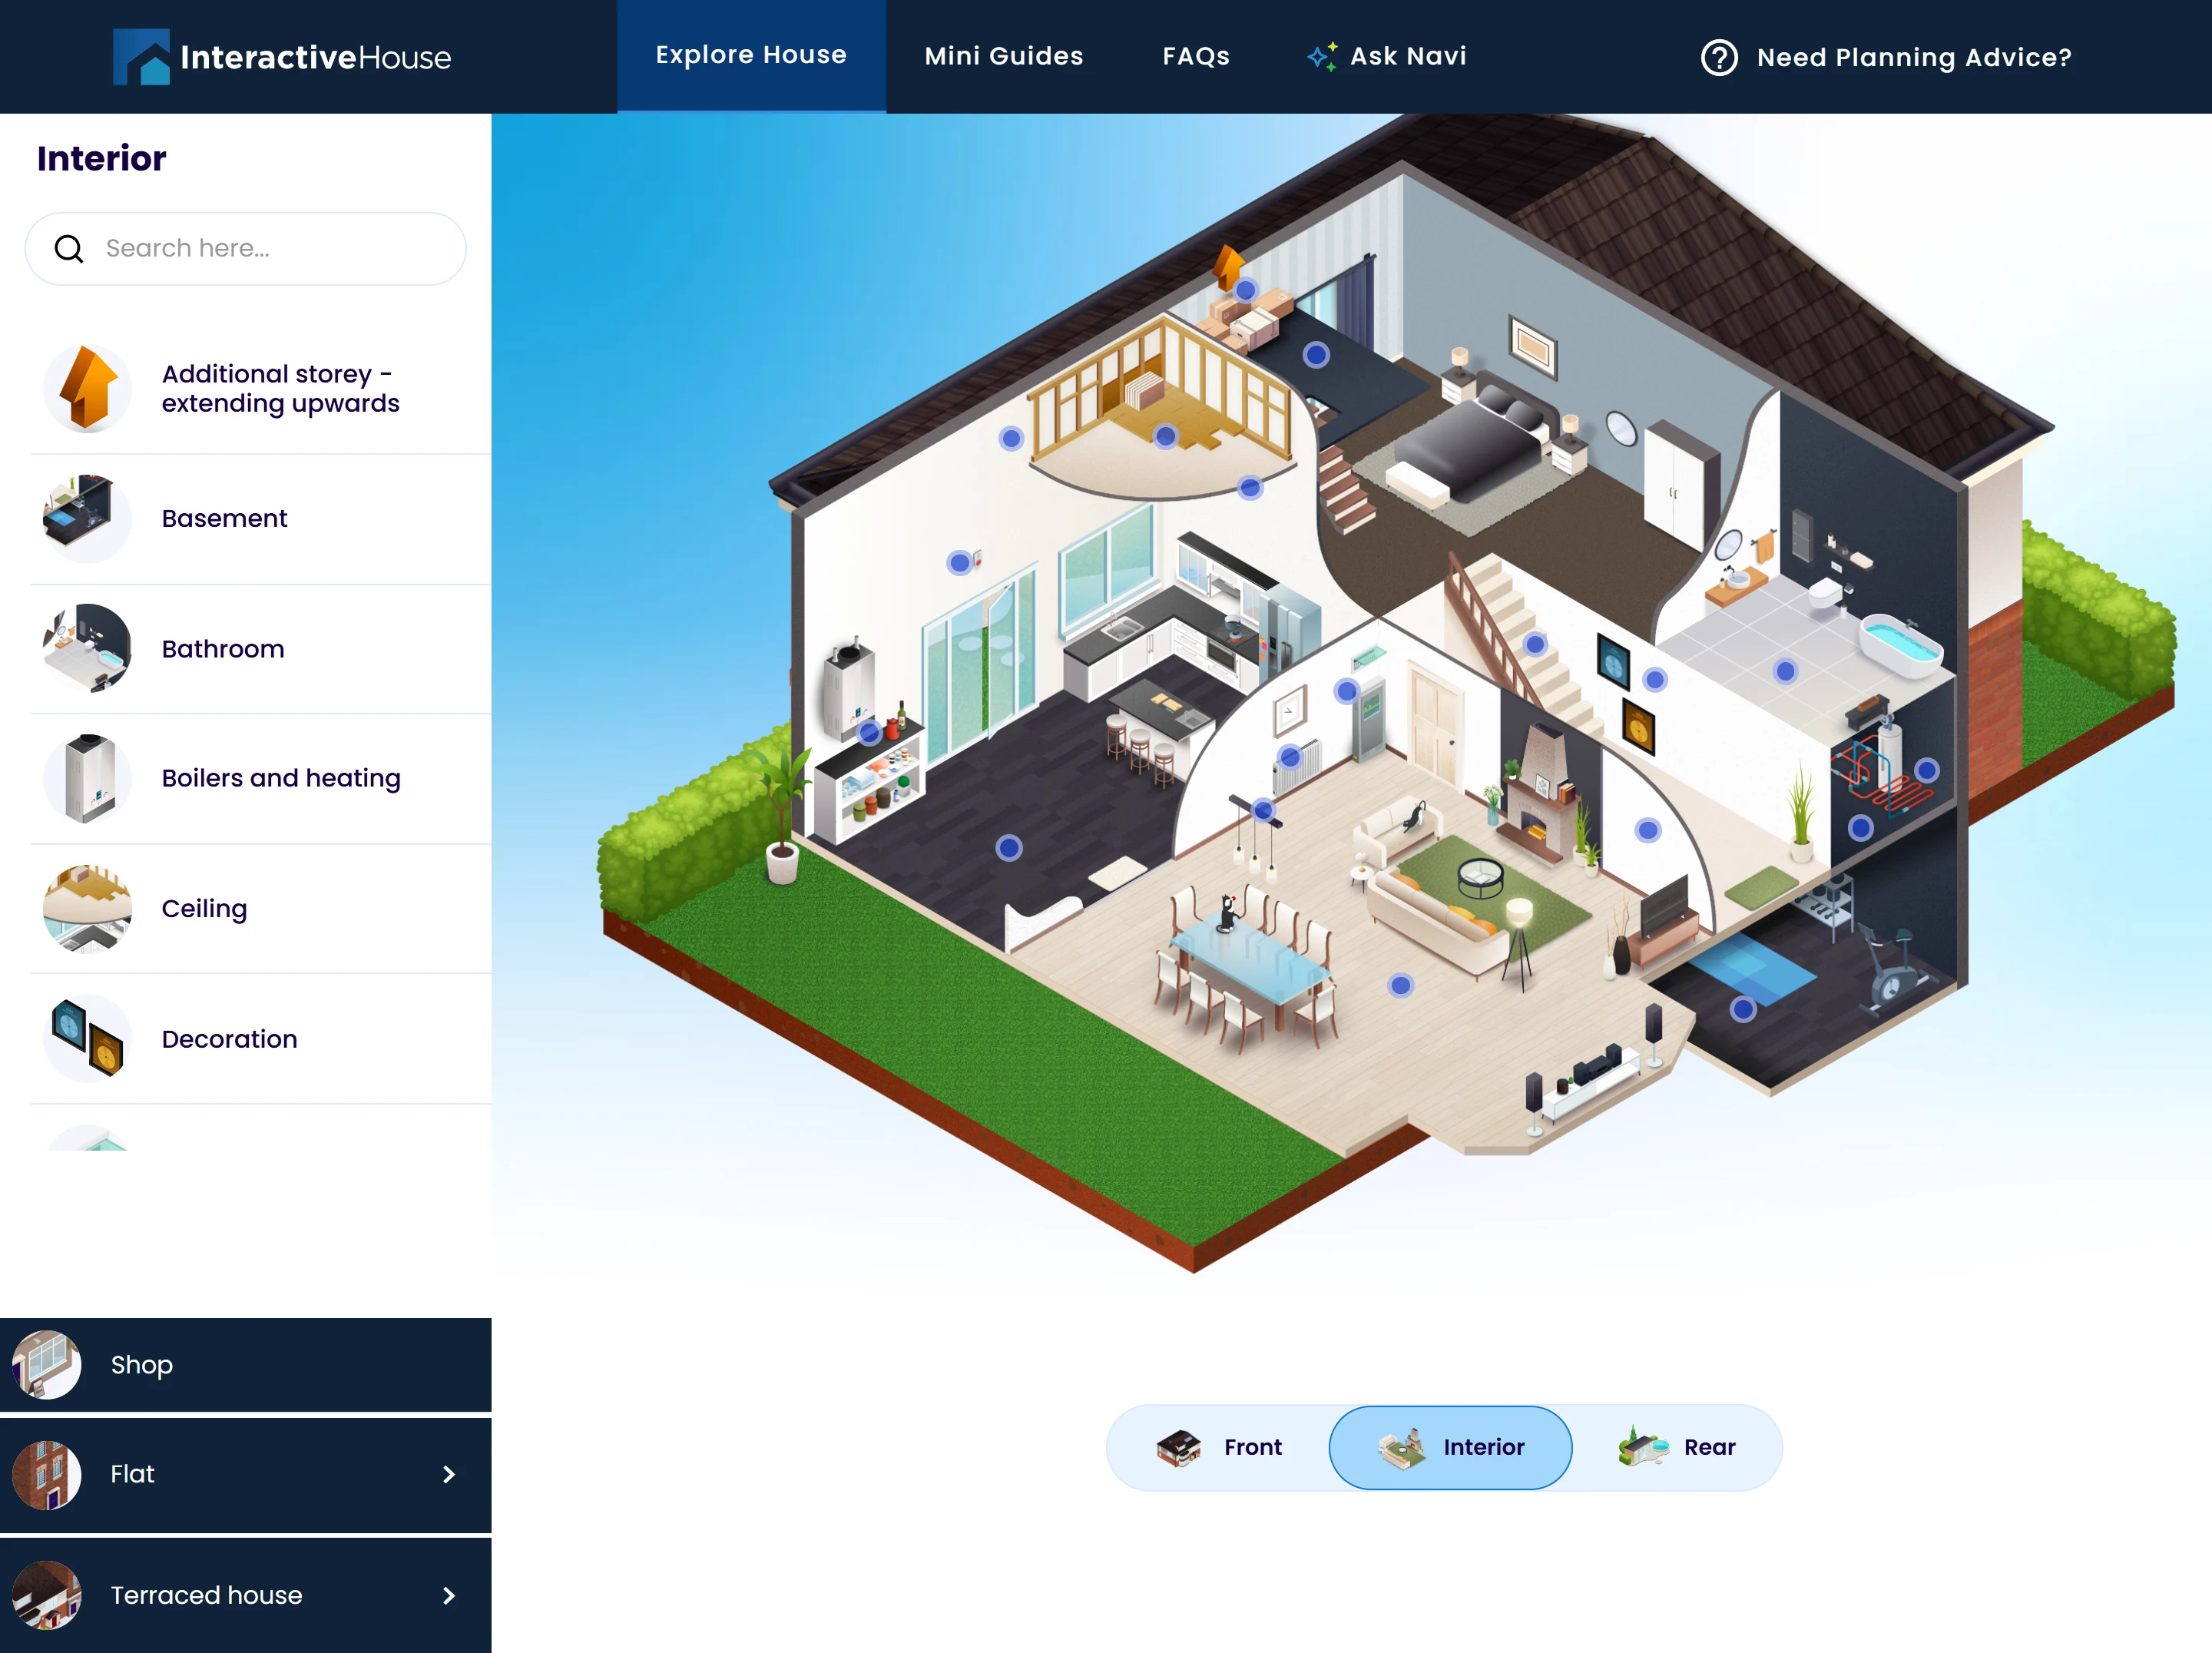
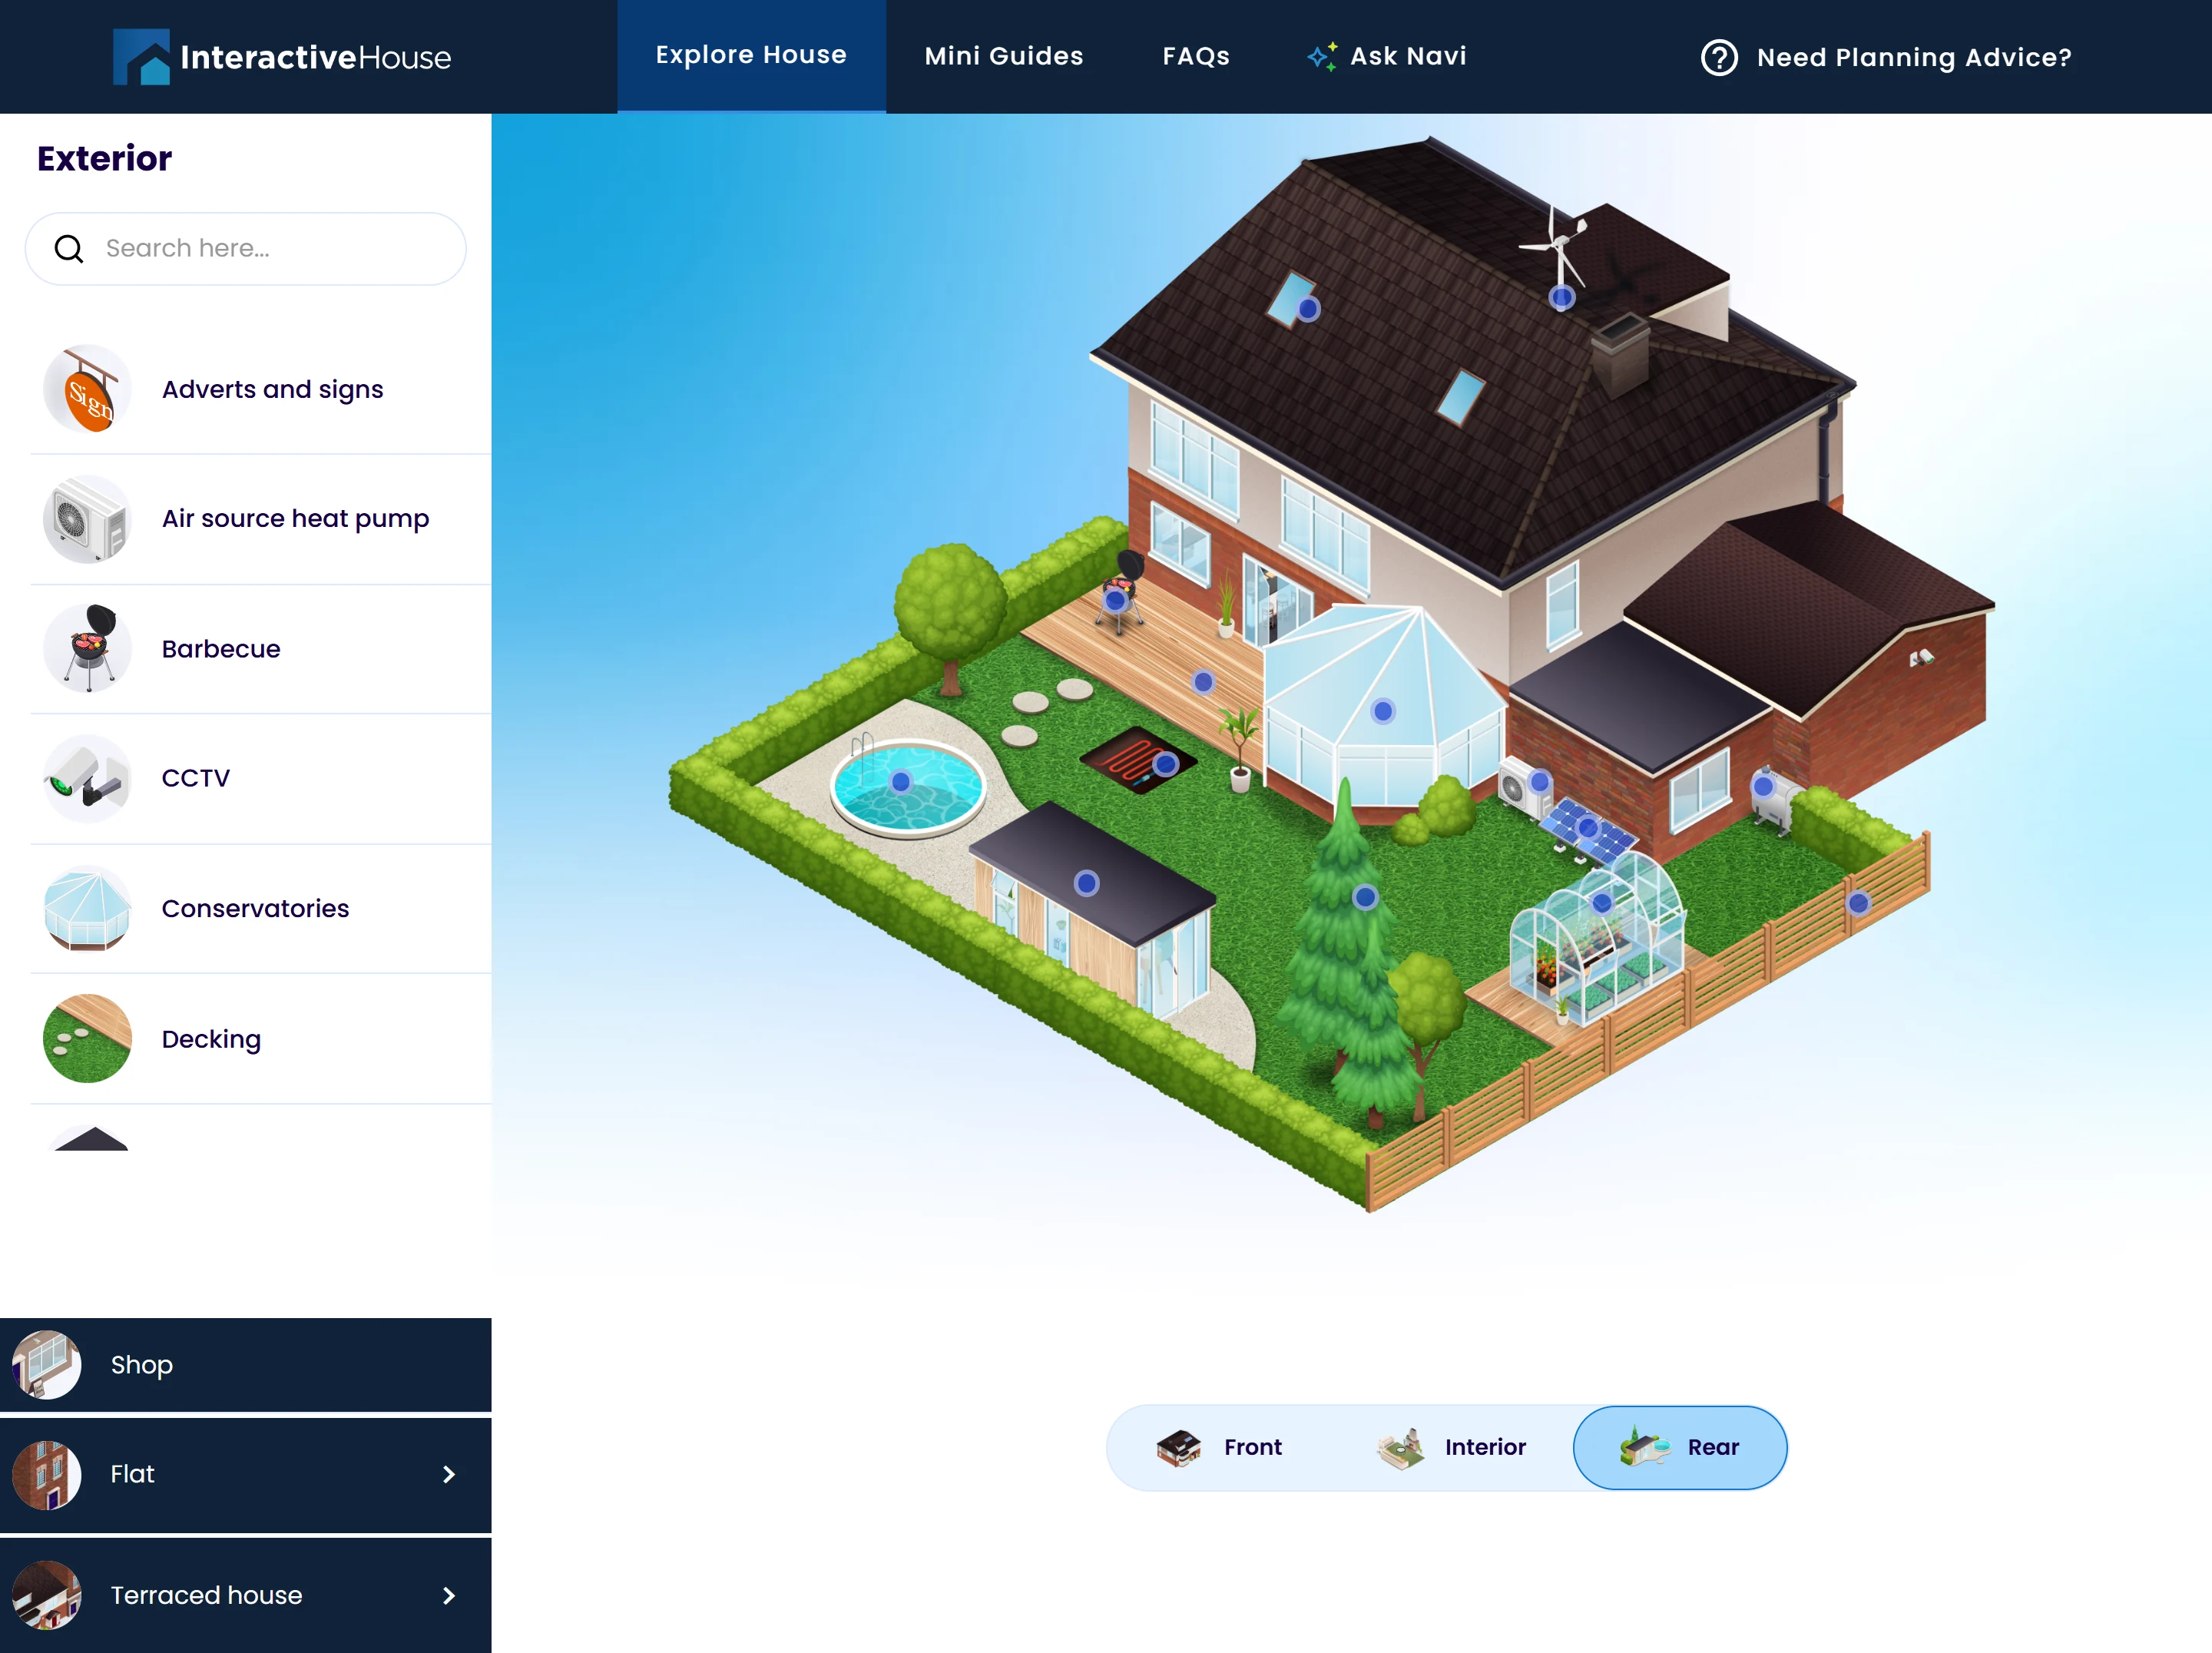
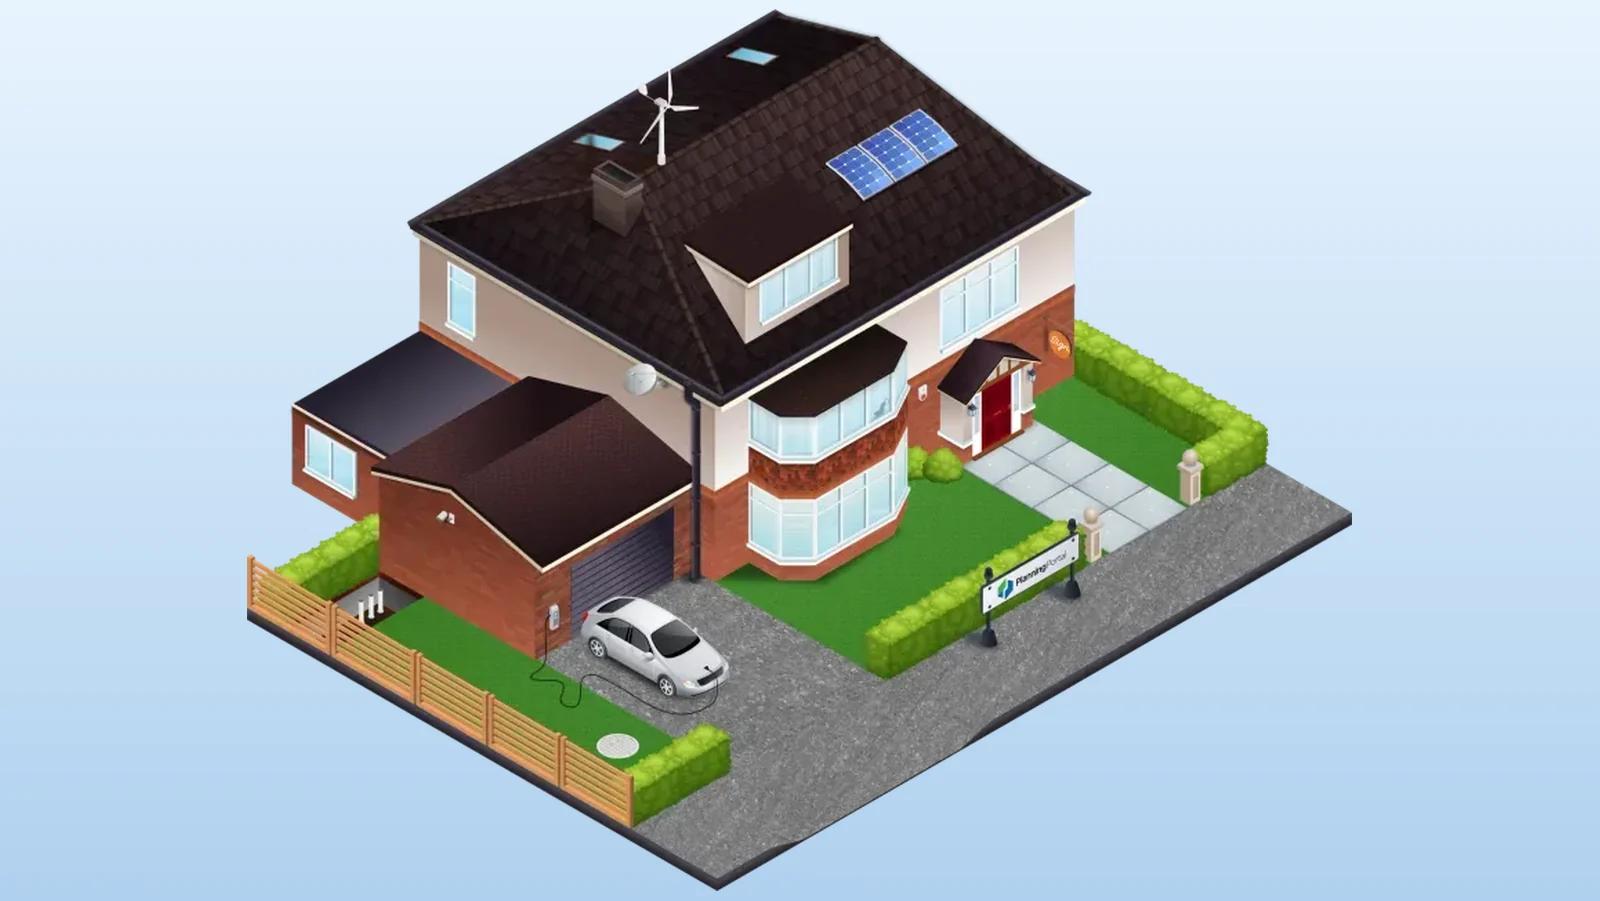
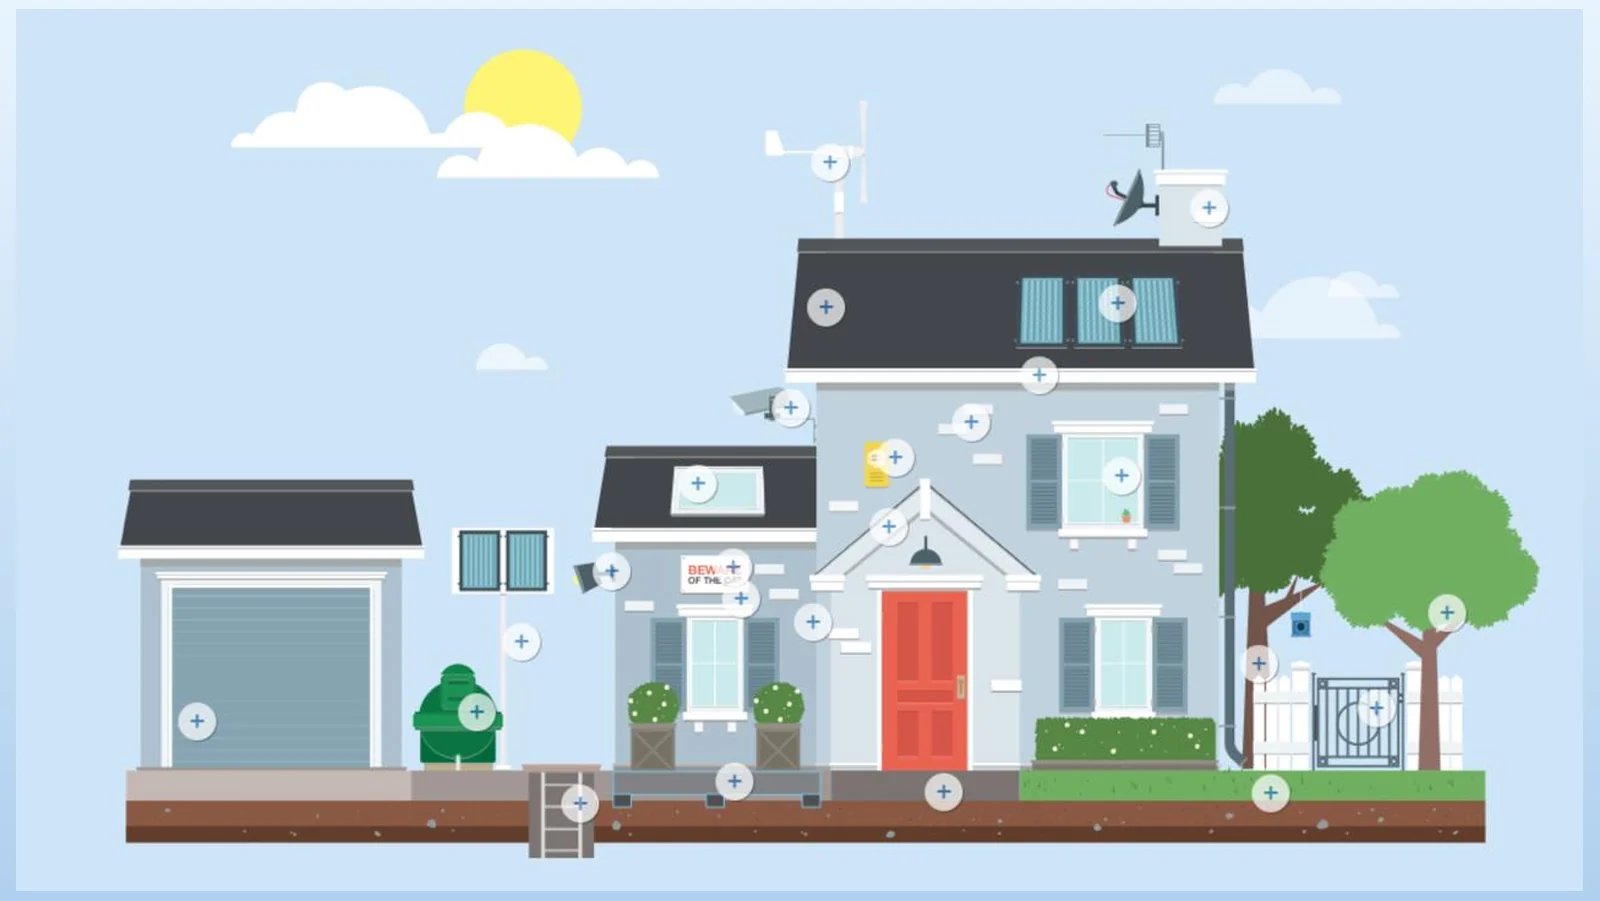
The same house, three views. Drag each handle to compare the old site with the rebuild.
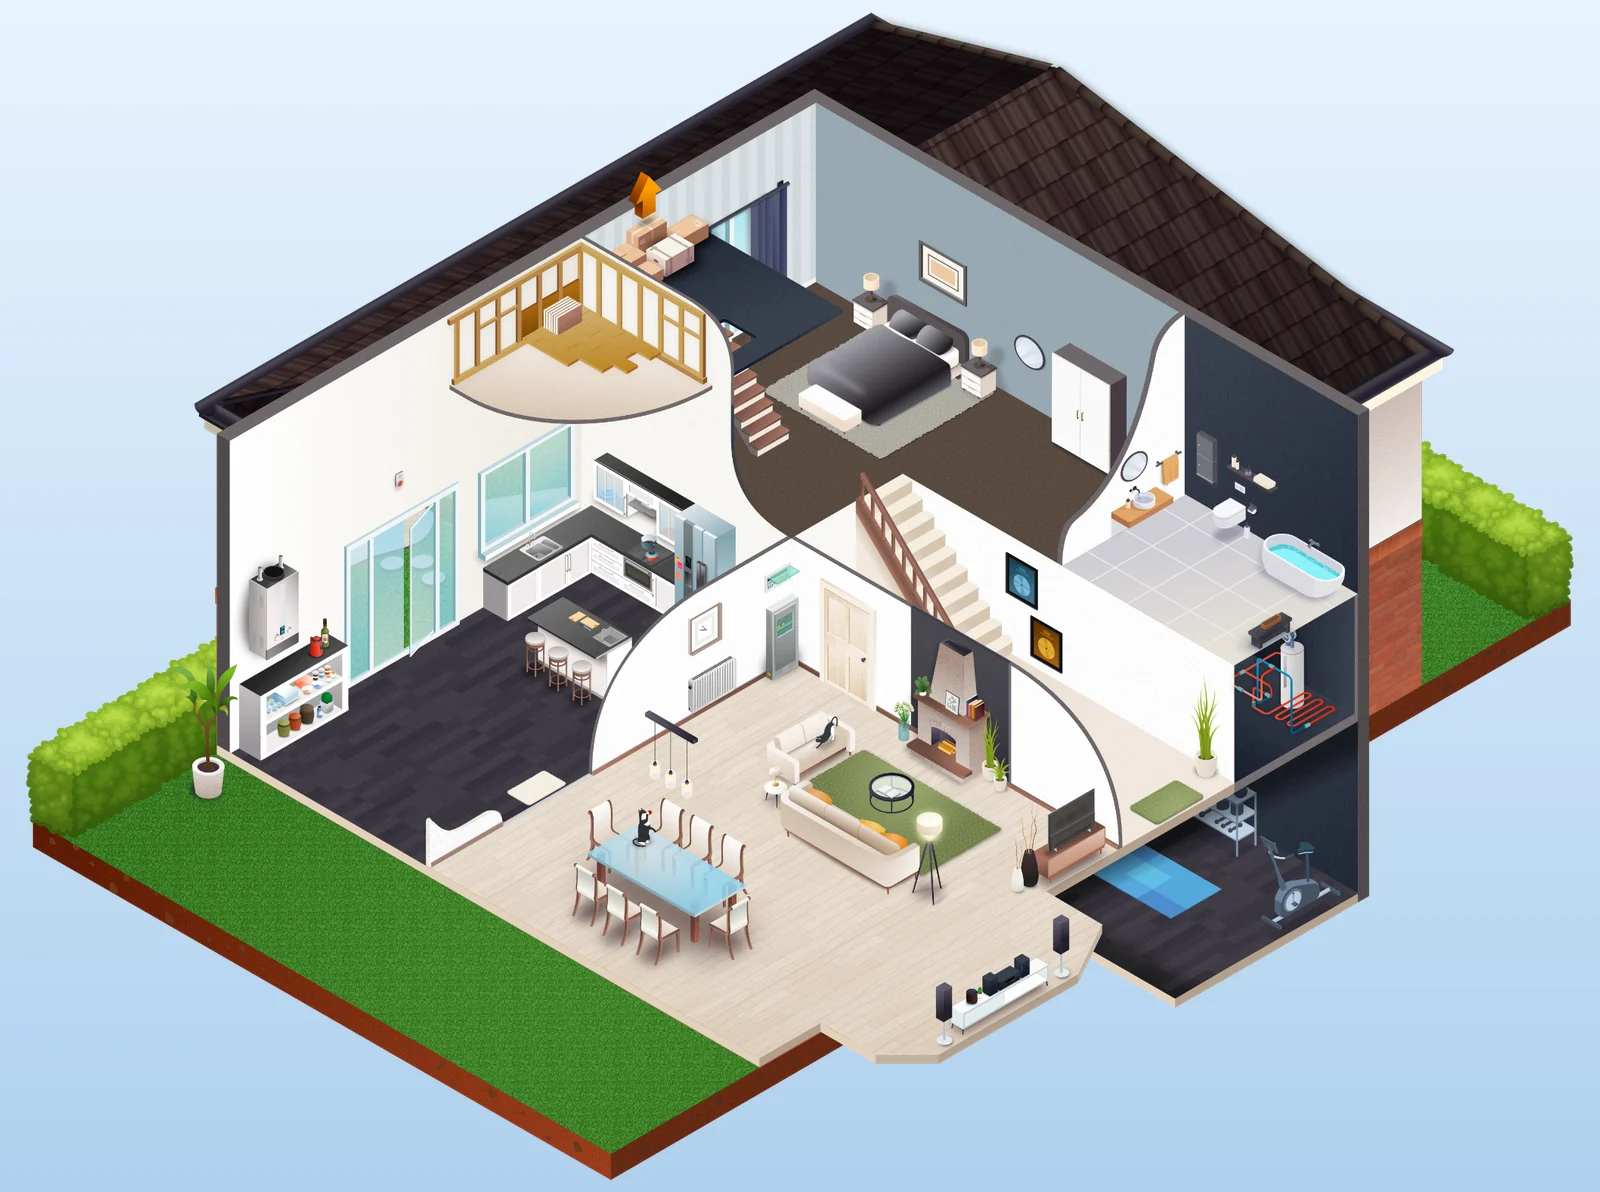
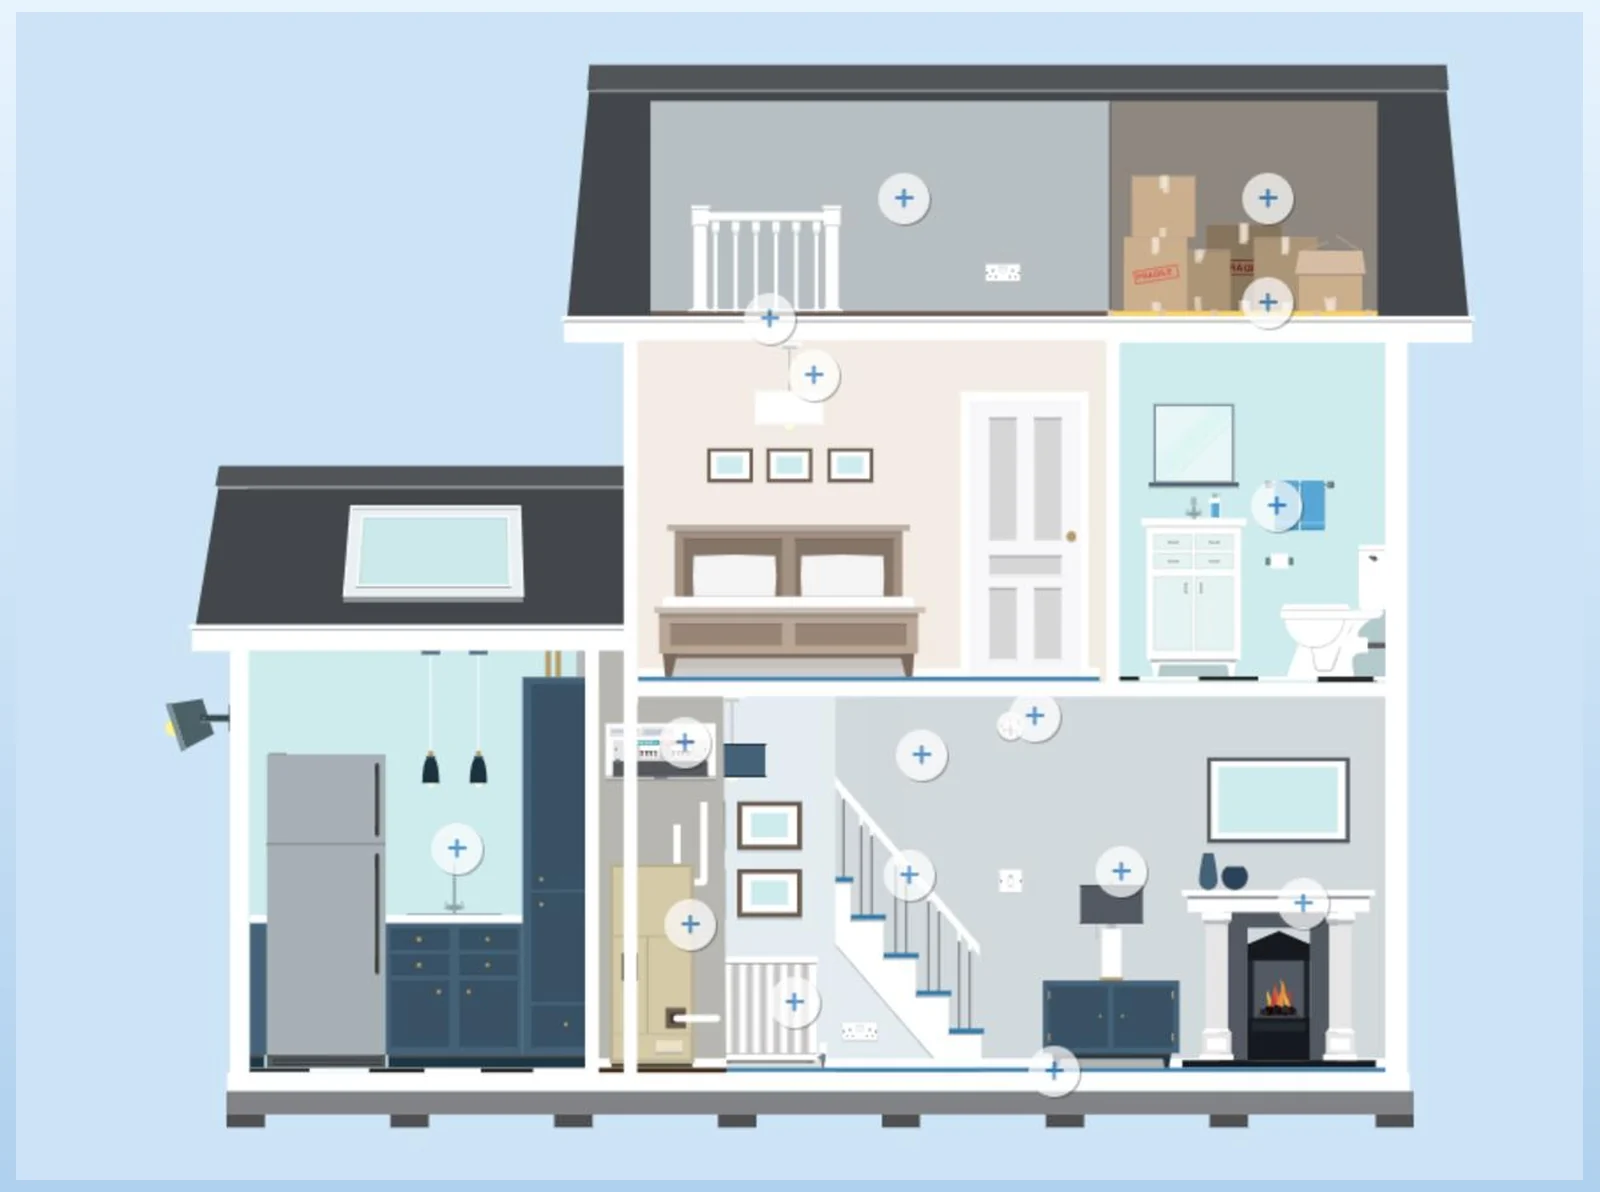
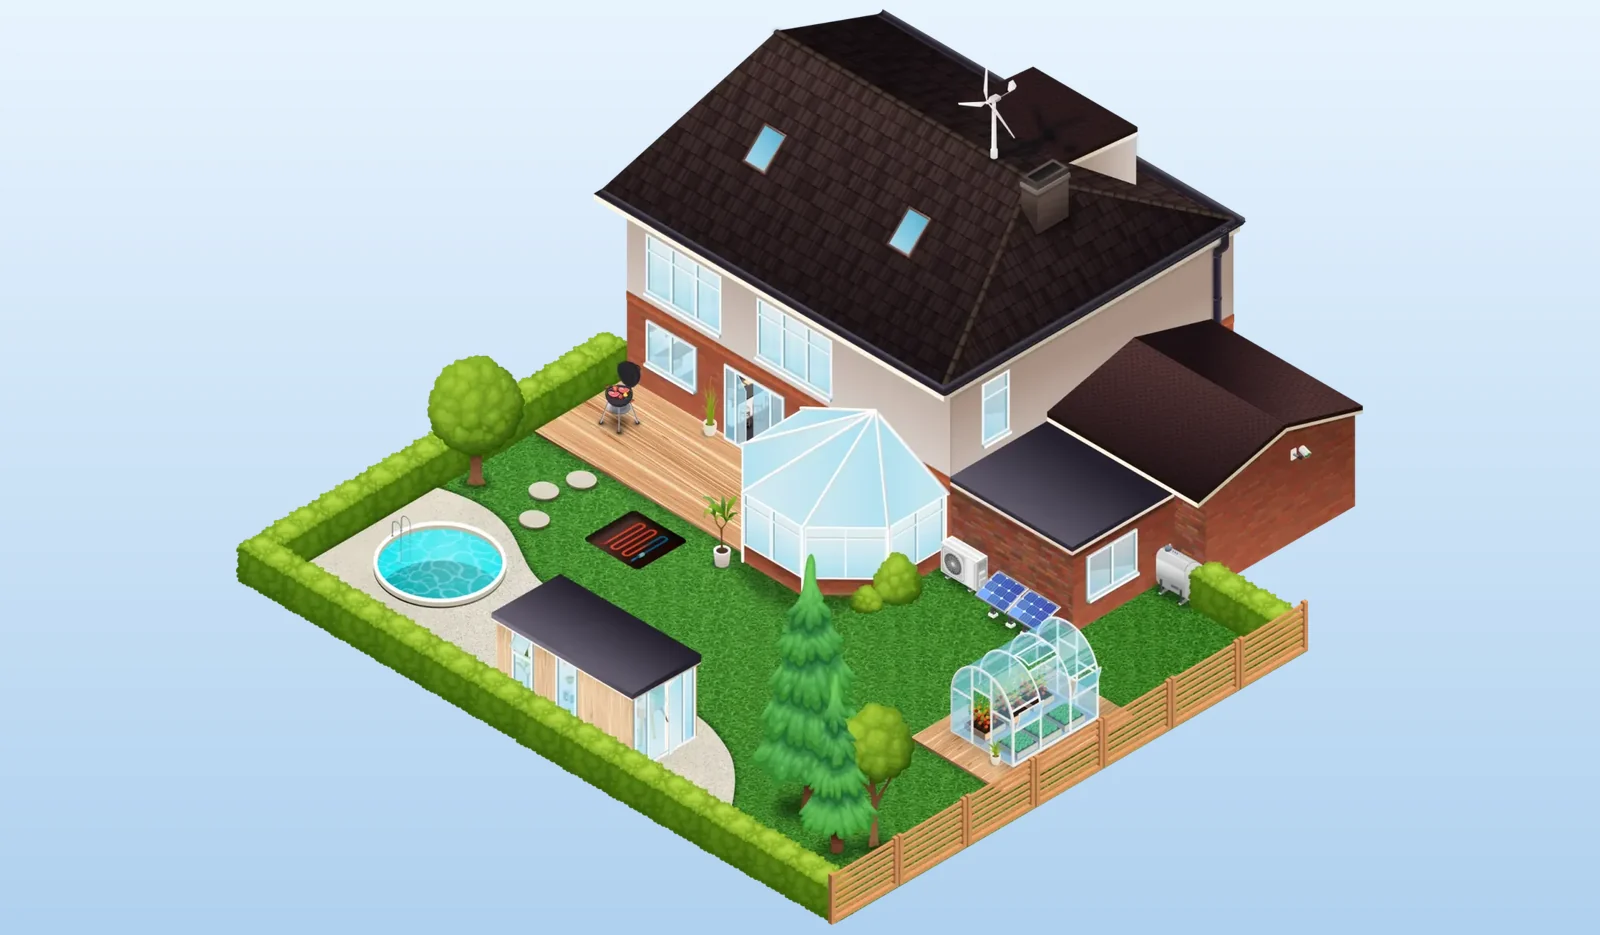
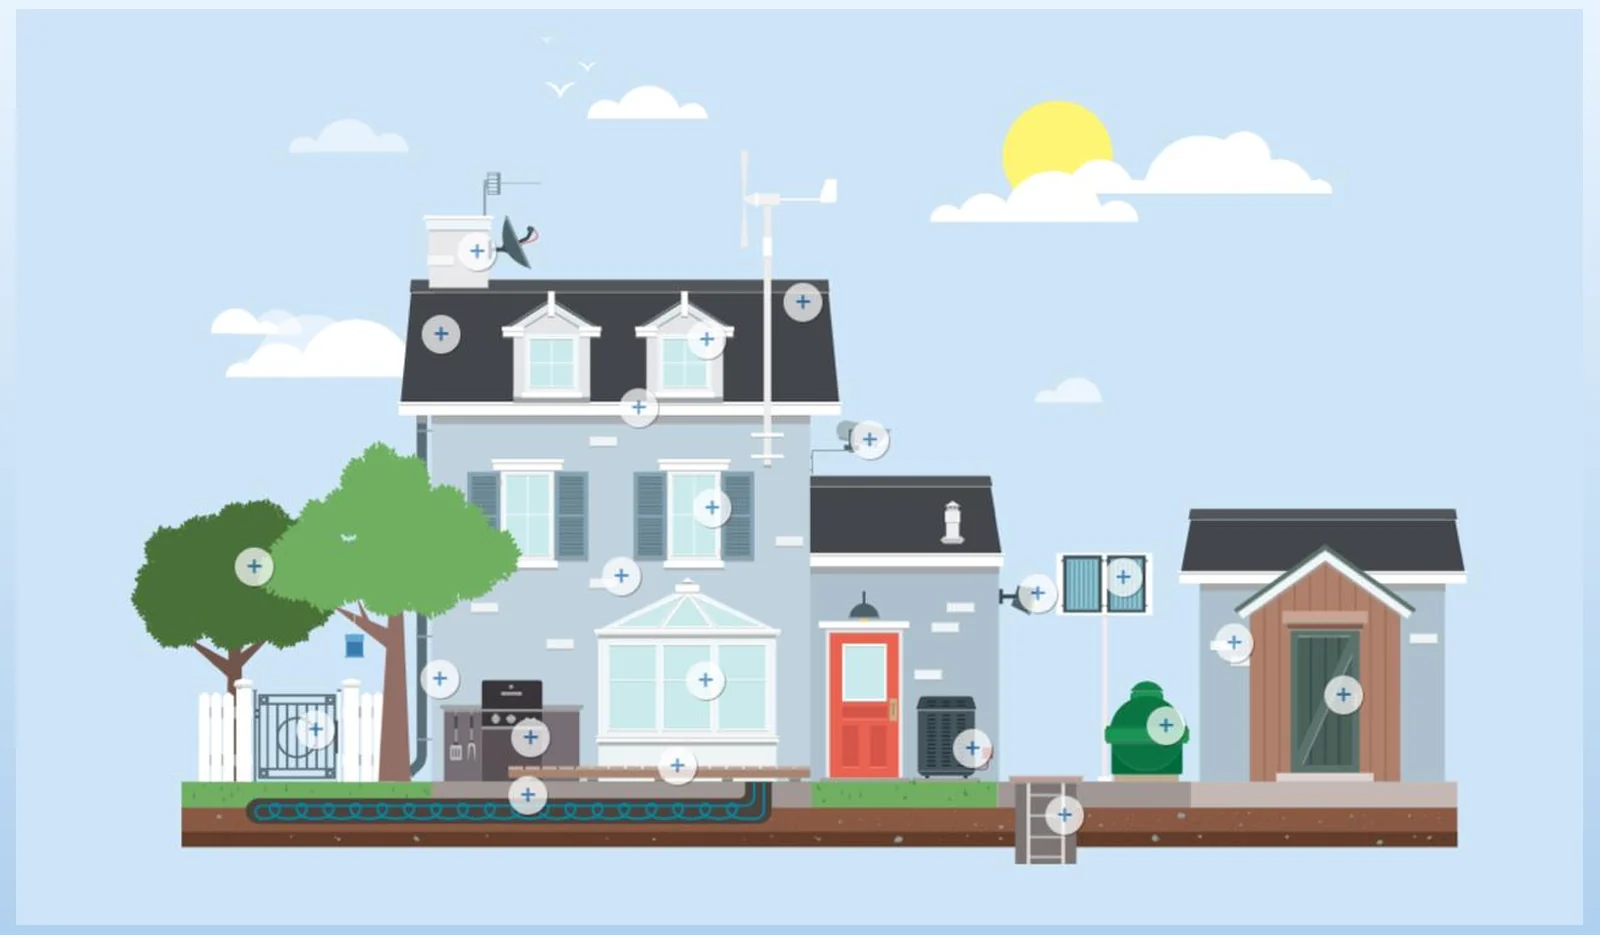
A year of iteration after launch, shaped by user research and the first year of analytics. Each release came from something users told us, not from a roadmap.
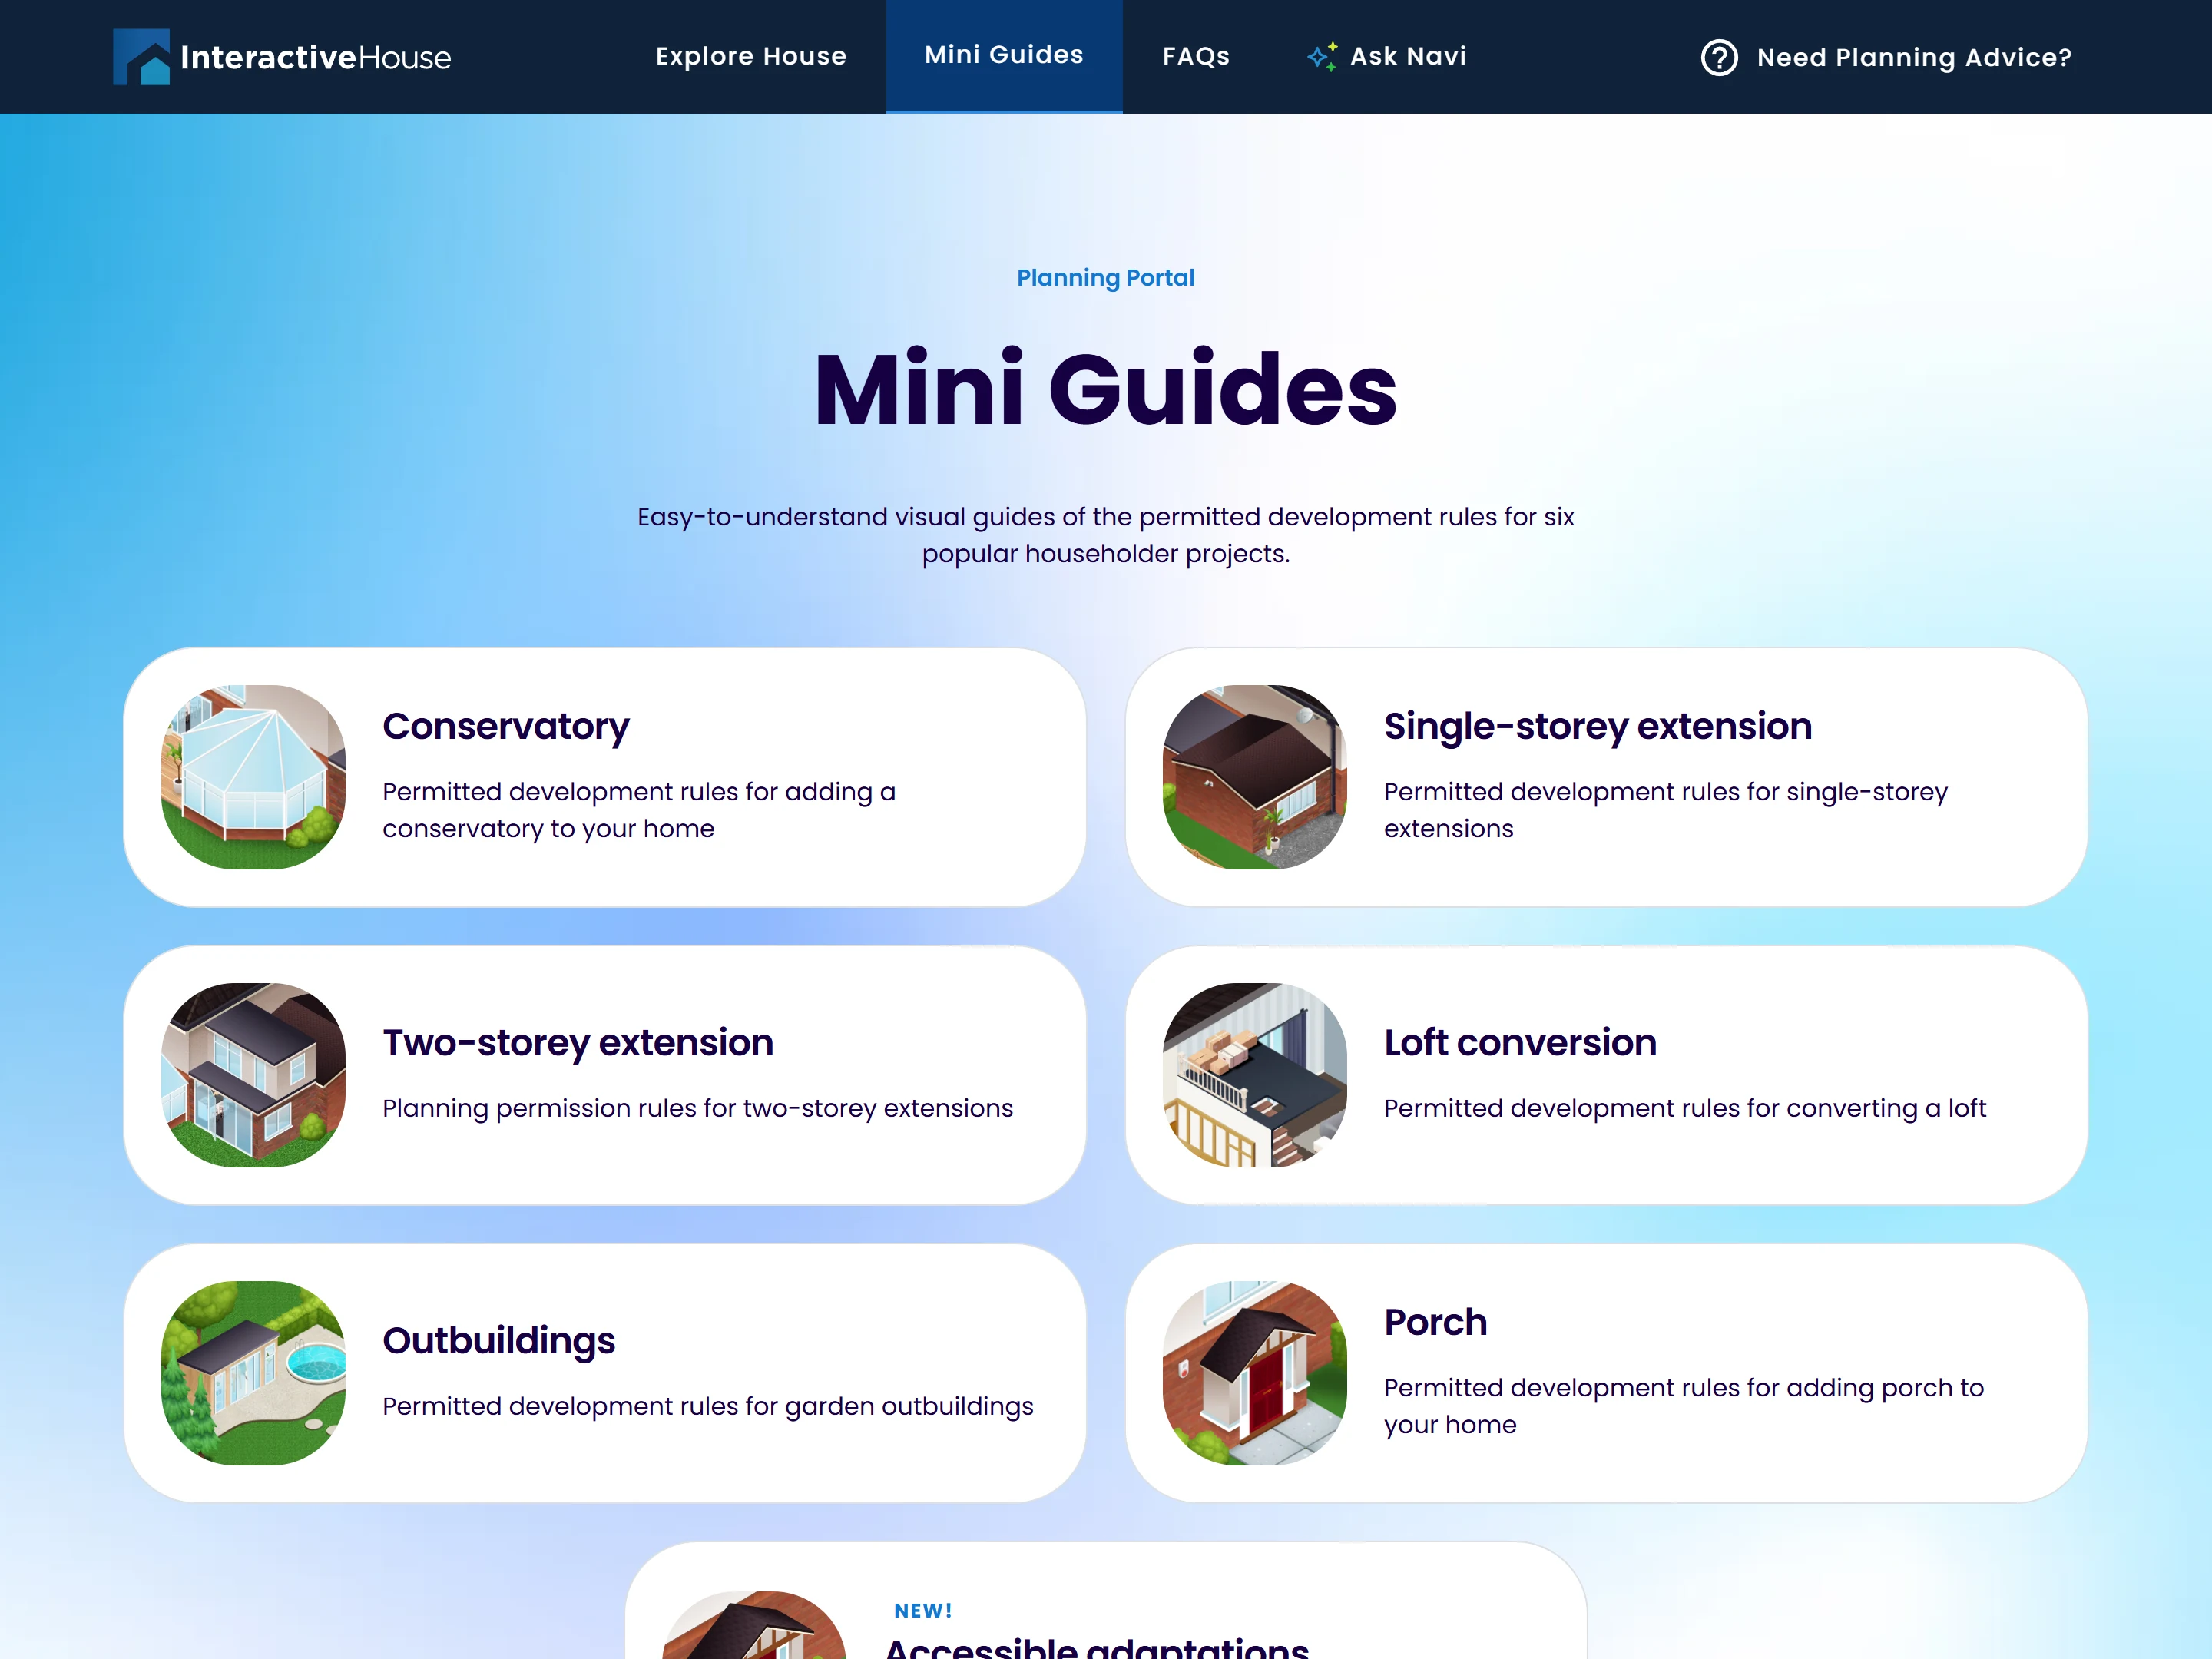
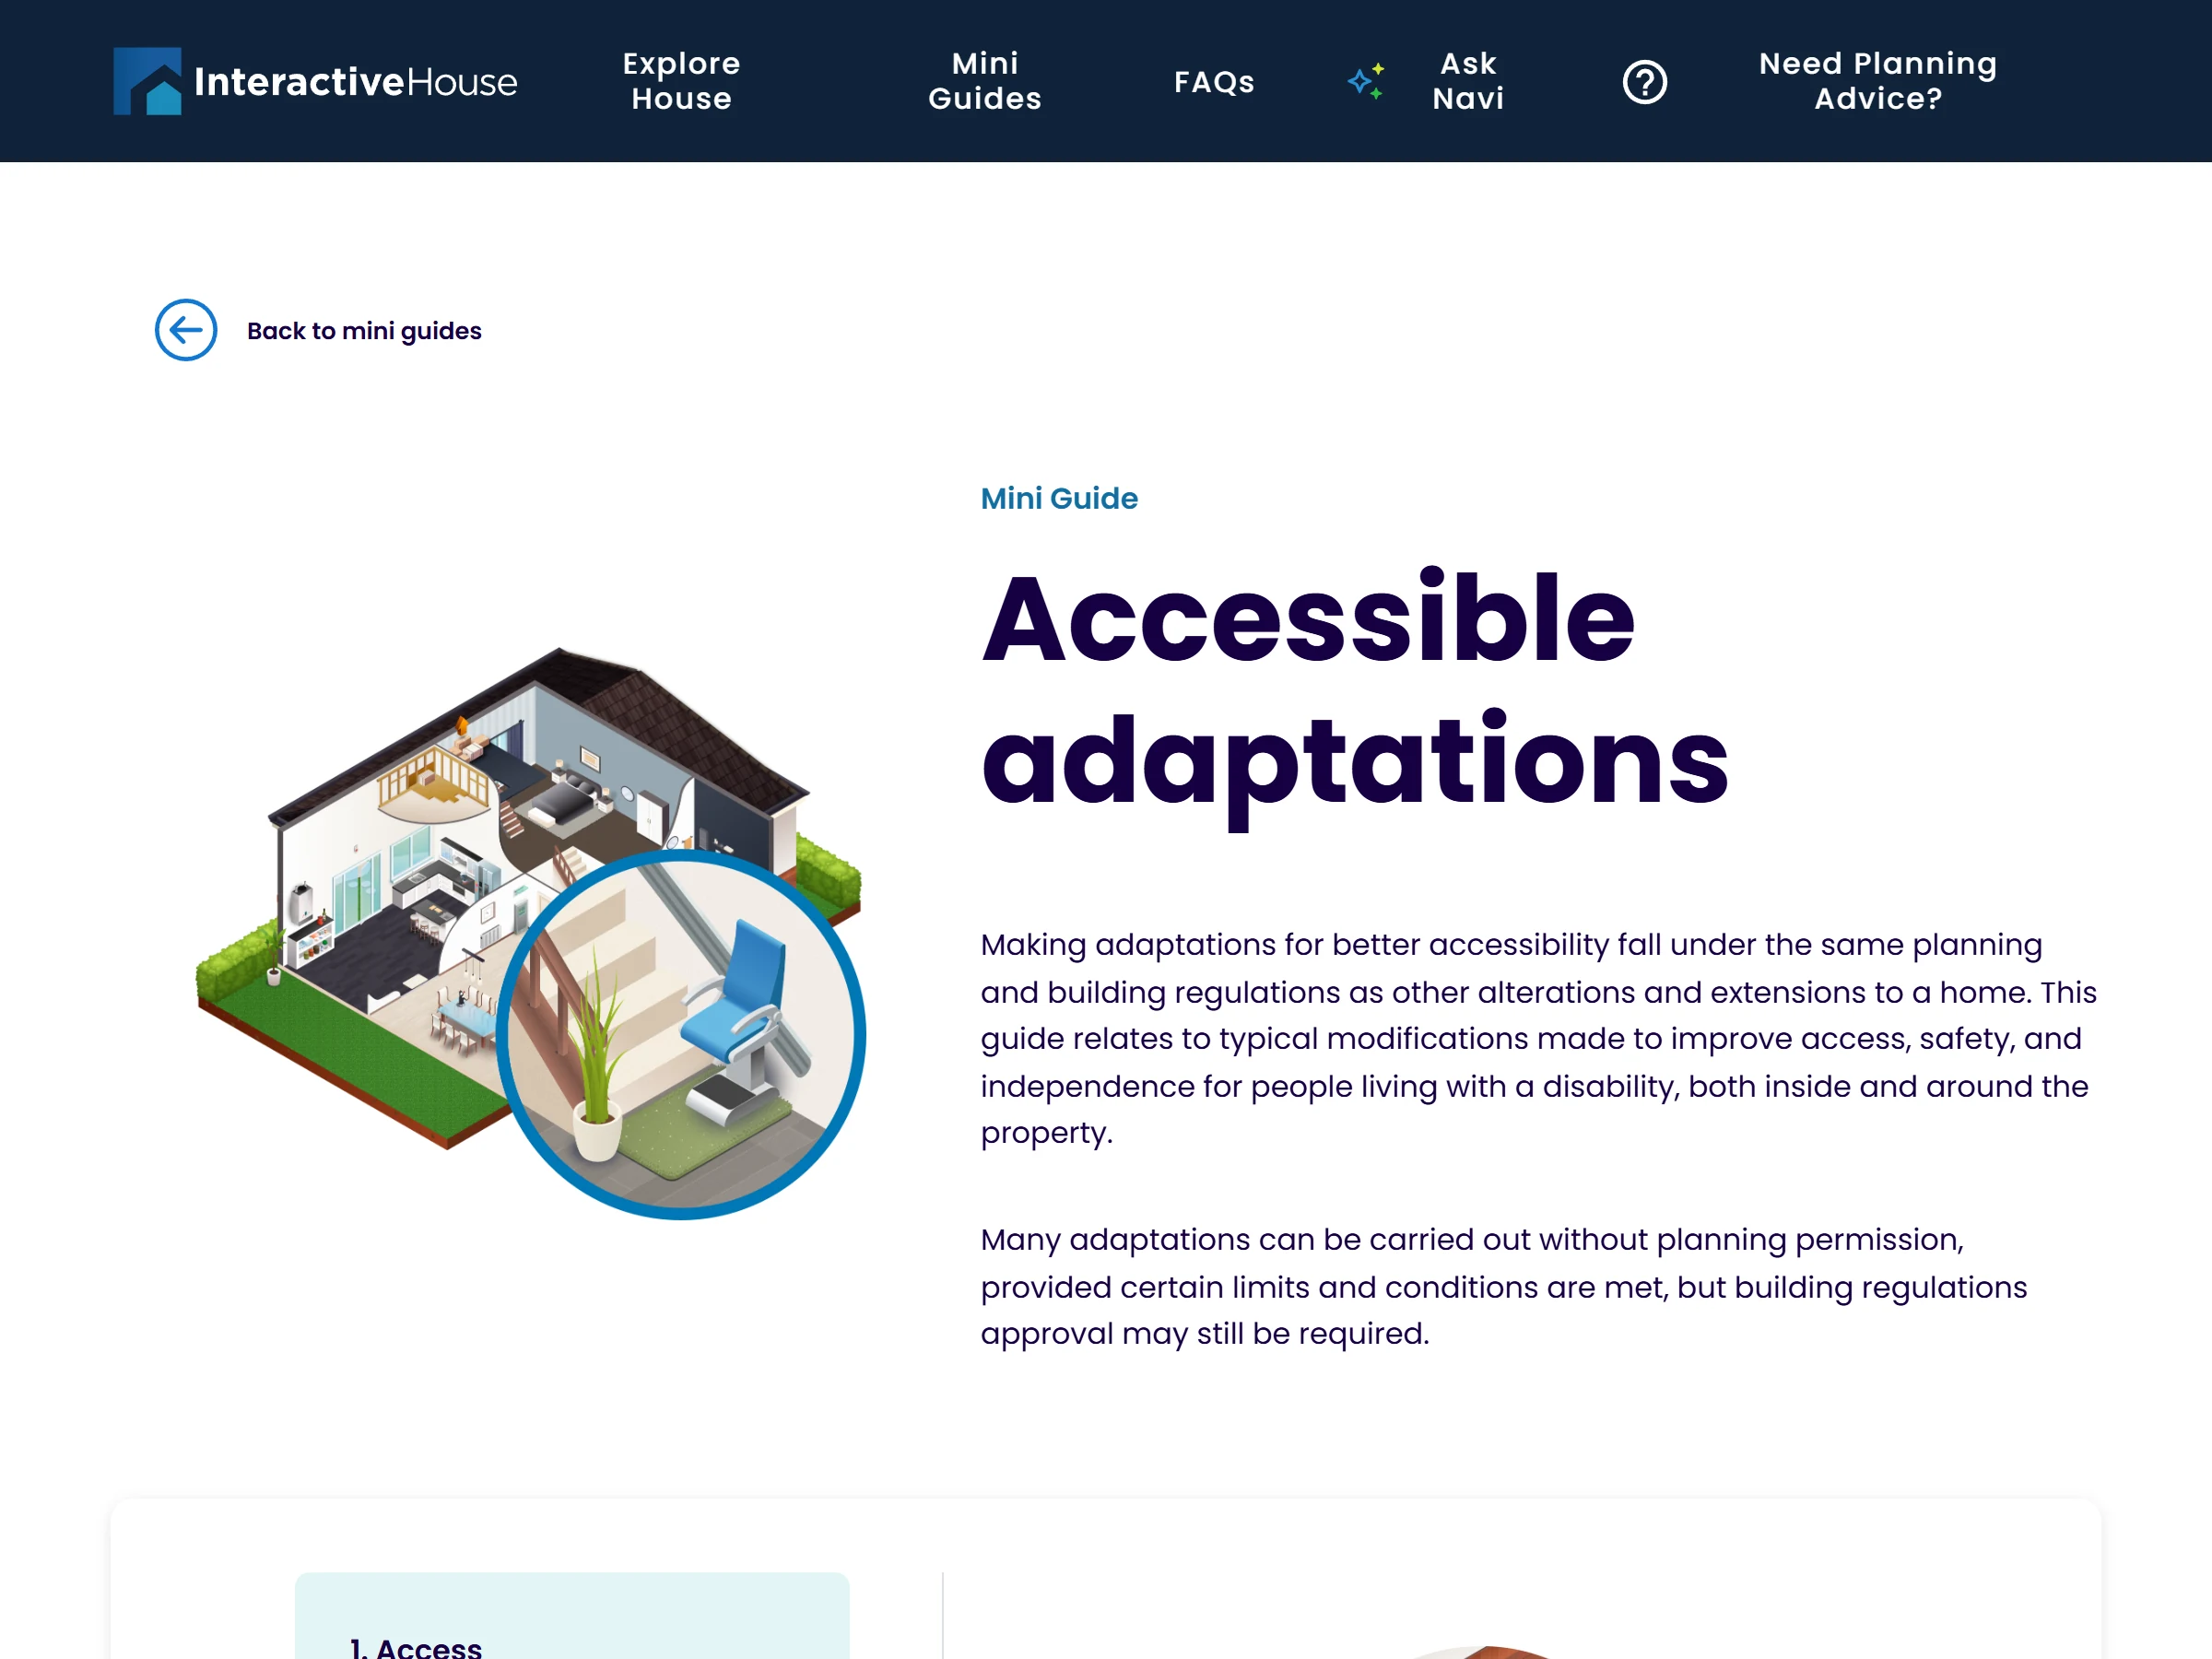
After launch, user interviews revealed a group we weren’t serving: people adapting a home because of disability or ageing. Ramps, stair lifts, wider doorways and accessible bathrooms all raise planning questions, and no guide covered them.
We researched the rules, interviewed users about what they needed to know, and grouped the requirements into one guide. Thanks to the shared content model, it shipped with no new navigation or illustrations.
The first full year of data, August 2025 to August 2026.
What the numbers show
What people did after launch backed up the decisions we made in research.
Of users are on mobile, with the biggest single screen group at around 360 to 410px wide. The old site could not serve them at all.
Users on the most-used page of the site, spending about 50 seconds there on average. The house is what people come for.
Average time on a mini guide. Visitors to the guides page open about 2 guides each.
The longest time spent anywhere on the site. About 15% of its users go on to another action, rising to about 25% when they come from the house explorer.
Of the first 100 or so published questions and answers came from users, suggested through smart search.
Of sessions. Layout shift scored under 0.01 and the main content loads in about 2 seconds.